LinkedIn KPI Benchmarks Explained
LinkedIn KPI benchmarks: Socialinsider 5.20% impression ER and format ladder vs Hootsuite 3.4% follower ER. Lock the denominator first.
Audio completion rate benchmark is a metric seat: IAB Ad Delivered vs Client-Confirmed (25-100%) plus a 98% streaming case, not a fake industry average.

TL;DR: An audio completion rate benchmark is not one industry percentage. Climb the Audio Completion Metric Ladder: IAB Ad Delivered (download/log seat) → Client-Confirmed Ad Play with 25% / 50% / 75% / 100% markers → named campaign cases such as IAB’s Coca-Cola streaming example at 98% completion. There is no public dataset for a single IAB-published universal average.
You need an audio completion rate benchmark for the media plan, and the slide wants one clean percentage. Listicles invent a median. IAB measurement docs invent a seat structure instead. Those are not the same answer.
This page owns the completion-metric job for podcast and streaming audio ads. Channel ROI debates live in influencer marketing vs paid ads and incrementality testing. Do not mash video VTR onto audio without naming the metric.
An audio completion rate benchmark is a planning reference for how often an audio ad plays through a defined completion seat, usually expressed as completed plays divided by started (or delivered) plays under a named measurement standard.
In podcasting, IAB separates download/delivery counting from client-confirmed play and quartile completion (Podcast Measurement v2.2). If your “benchmark” does not name which seat it uses, it is not comparable across vendors.
Streaming audio often reports player-side completion because the ad unit lives inside a controlled session. Downloaded podcast ads often report delivery from filtered logs before a player ever confirms play. Mixing those seats produces a fake industry curve. The benchmark you want is the ladder step your contract and your vendor both report.
Audio completion rate benchmarks matter because audio often finishes more of the ad unit than skippable video, but buyers still underweight the channel relative to time spent. Completion without a metric definition becomes a vanity slide.
| Seat | What it counts | Use when |
|---|---|---|
| Ad Delivered | Download / log delivery per IAB podcast rules | Inventory and delivery reconciliation |
| Client-Confirmed Ad Play (start) | Client beacon that play began | Comparable “started” denominator |
| Quartile / 100% complete | 25 / 50 / 75 / 100 markers when available | Creative and placement quality |
| Named campaign case (e.g. 98%) | One campaign’s reported completion | Proof of format potential, not a census |
Sources: IAB Podcast Measurement v2.2; IAB Getting Audio & Podcasting on the Media Plan (Oct 2024). https://iabtechlab.com/wp-content/uploads/2024/02/PodcastMeasurement_v2.2_pc.pdf · https://www.iab.com/wp-content/uploads/2024/10/IAB_Getting_Audio_Podcasting_on_the_Media_Plan_October_2024.pdf
Audio completion rate benchmarks work as an Audio Completion Metric Ladder. You pick the seat, then you compare only campaigns that share that seat. You do not average Ad Delivered with Client-Confirmed 100% and call it science.
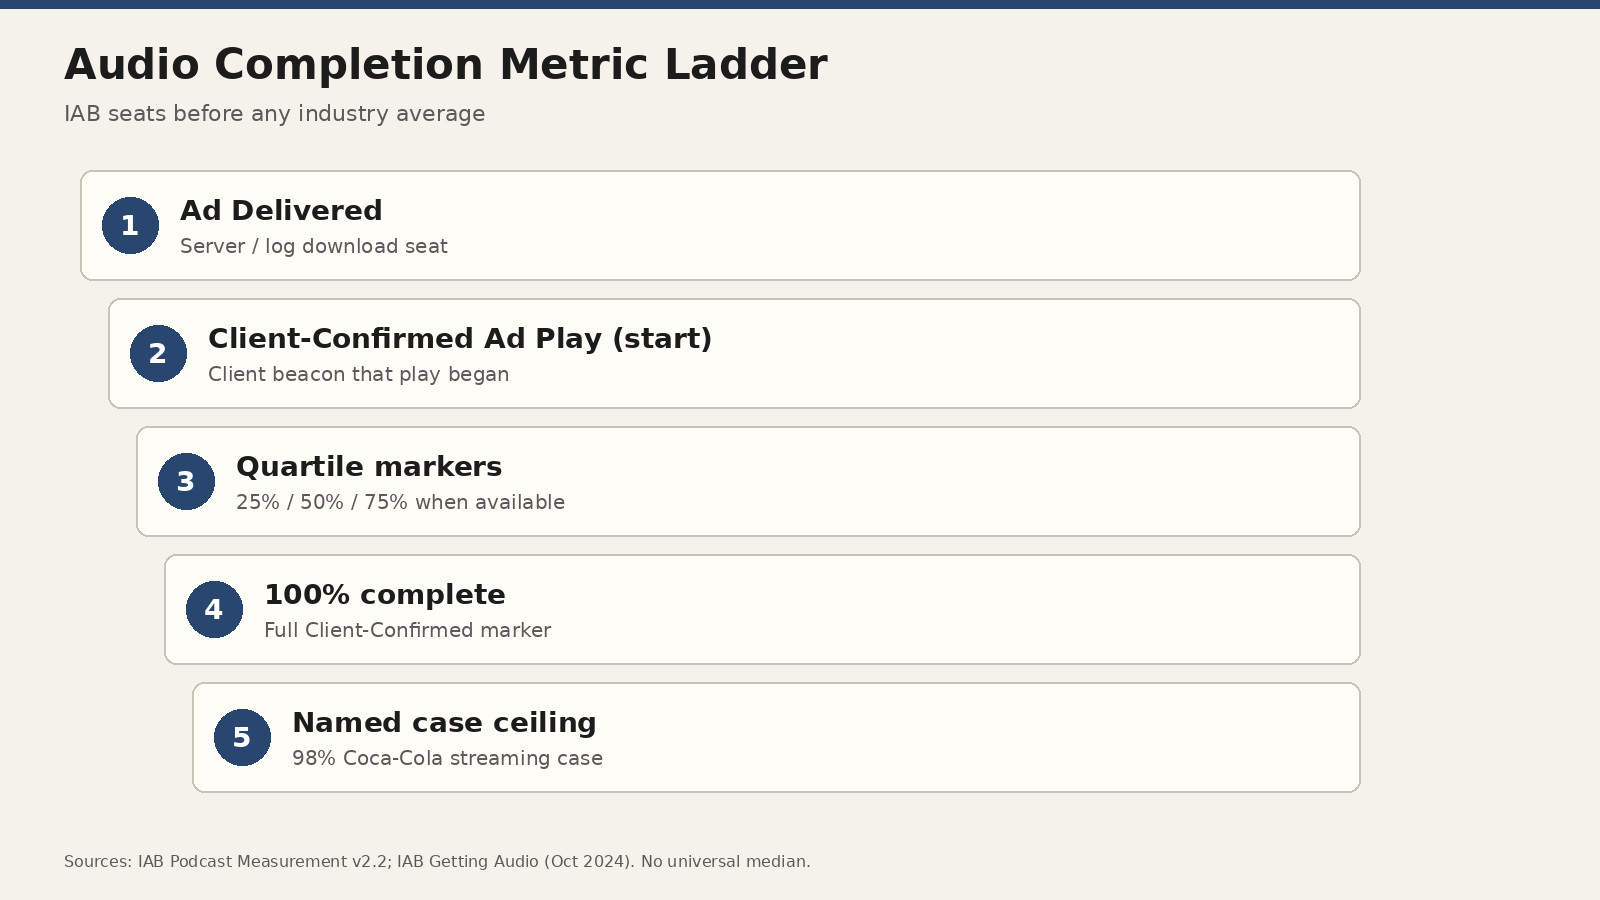
Sources: IAB Tech Lab Podcast Measurement v2.2; IAB Getting Audio & Podcasting on the Media Plan (Oct 2024). https://iabtechlab.com/wp-content/uploads/2024/02/PodcastMeasurement_v2.2_pc.pdf · https://www.iab.com/wp-content/uploads/2024/10/IAB_Getting_Audio_Podcasting_on_the_Media_Plan_October_2024.pdf
| Metric | Published figure | Role |
|---|---|---|
| Share of digital media time (18+) | ~20% | Demand for attention |
| US monthly / weekly listening | ~80% / ~70% | Reach context |
| Attentive seconds vs other media | +56% per thousand impressions | Attention quality |
| Auto ROAS lift from 1.8% budget shift | +23% overall ROAS (Neustar, 40+ advertisers) | Mix sensitivity |
| Time vs digital ad revenue | ~20% time vs ~2.9% revenue | Underinvestment gap |
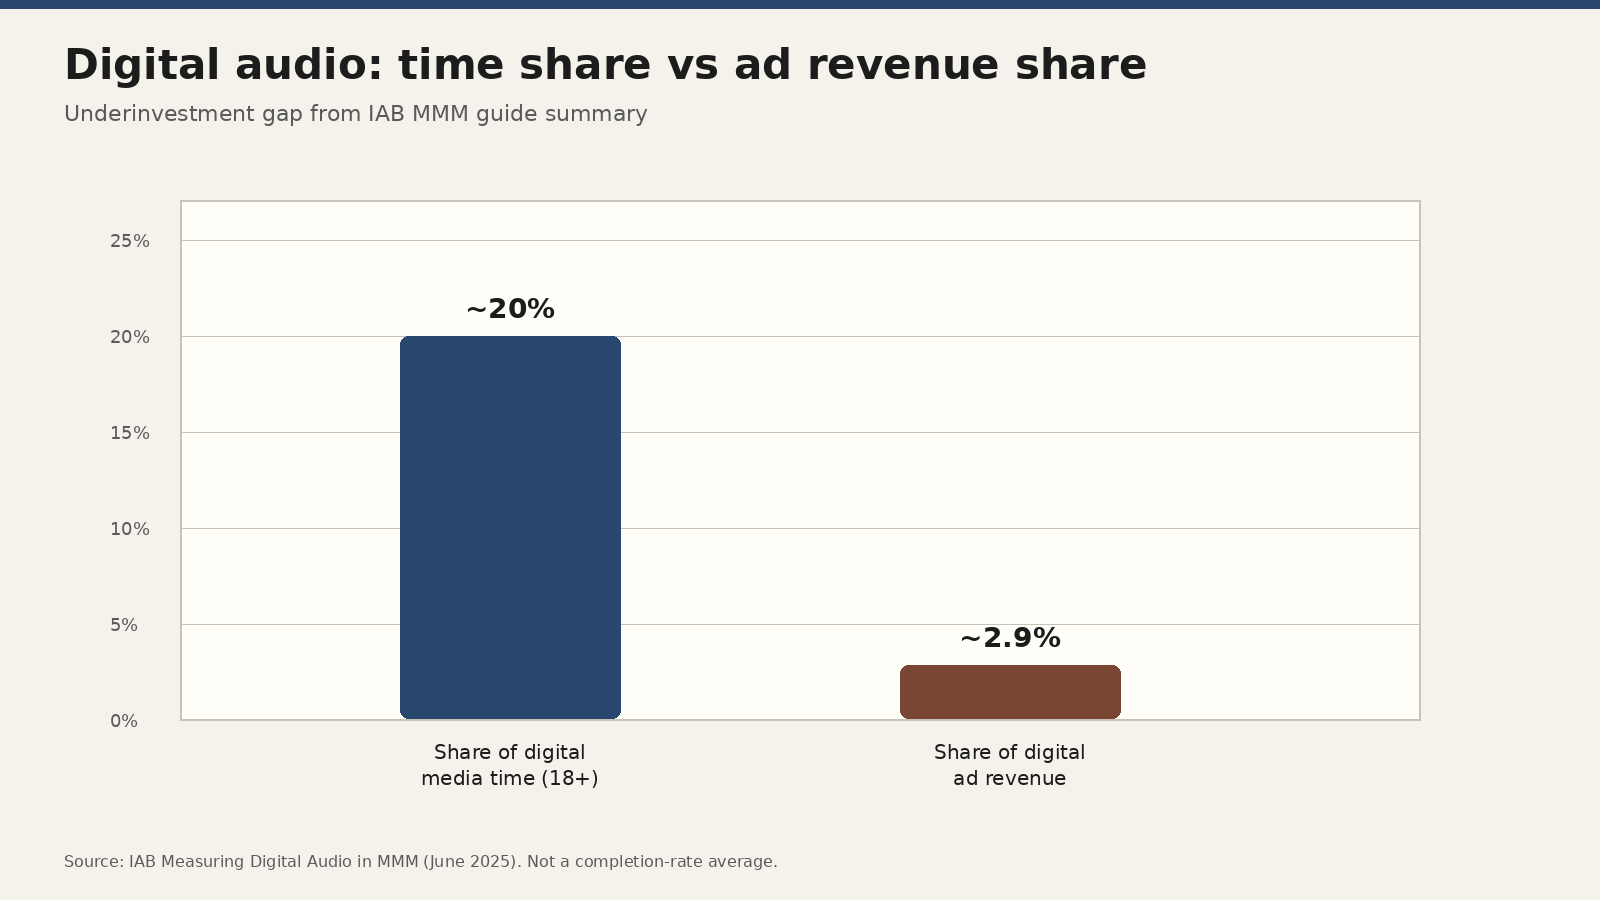
Source: IAB Measuring Digital Audio in Media Mix Models (June 2025), summarizing prior Guide figures. https://www.iab.com/wp-content/uploads/2025/06/IAB_MeasuringDigitalAudioinMMM_June_2025_FINAL.pdf
| Figure | Type | Source |
|---|---|---|
| 98% ad completion | Single campaign case (Coca-Cola streaming) | IAB Getting Audio, Oct 2024 |
| 88.74% audibility (vs 70% DGMN norm) | Same campaign case | IAB Getting Audio, Oct 2024 |
| $6.57 ROAS | Same campaign case | IAB Getting Audio, Oct 2024 |
| Universal industry average completion % | no public dataset from IAB | Do not invent |
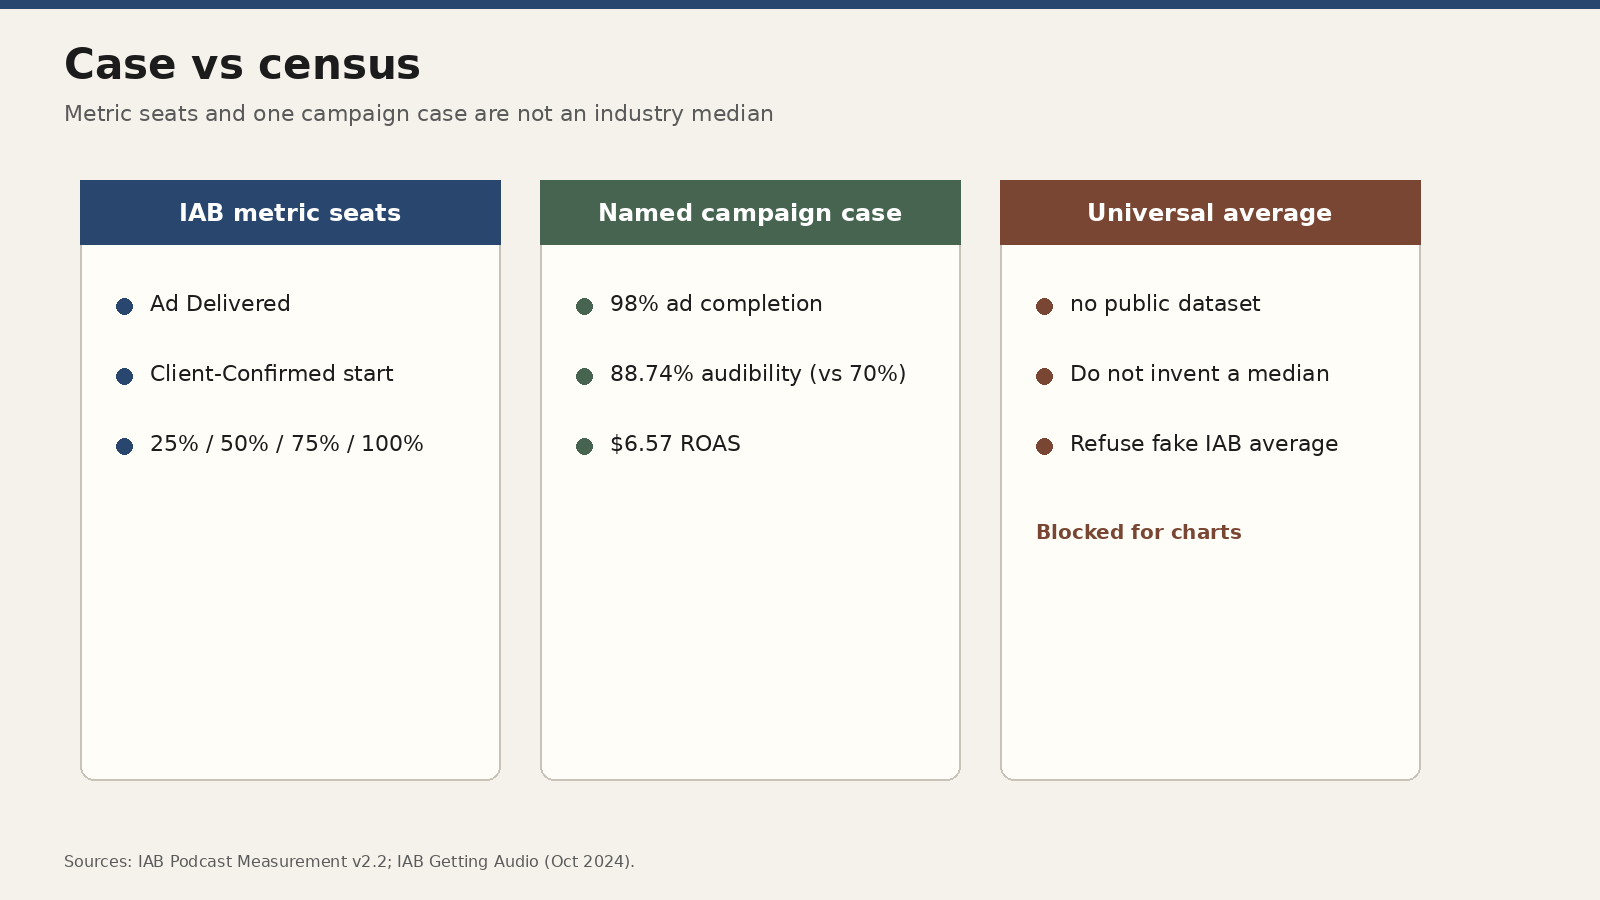
Sources: IAB Podcast Measurement v2.2; IAB Getting Audio (Oct 2024). https://iabtechlab.com/wp-content/uploads/2024/02/PodcastMeasurement_v2.2_pc.pdf · https://www.iab.com/wp-content/uploads/2024/10/IAB_Getting_Audio_Podcasting_on_the_Media_Plan_October_2024.pdf
Write the RFP line as a metric seat, not as a vibes target. Example: “Report Client-Confirmed Ad Play start and 100% complete where available; reconcile Ad Delivered separately for podcast downloads.” That sentence stops three common fights: host-read downloads counted as listens, streaming completion mashed onto RSS delivery, and a vendor quoting 98% from a non-skippable case as if every mid-roll behaved the same.
If the buy mixes podcast and streaming, keep two scorecards. Podcast inventory can win on reach and host trust while streaming wins on structural completion. Your media plan should show both seats side by side. Do not force one percentage into both columns.
Completion is not brand lift. It is not sales. It is not incrementality. High completion with weak creative still wastes attentive seconds. Low completion with a skippable unit can still win on cost-per-completed-listen if the creative converts. Pair the ladder with outcome seats you already trust elsewhere: lift tests, MMM coefficients, and post-purchase codes when creators sell through co-branded paths.
Q: What is a good audio completion rate benchmark? A: Start with the metric seat. IAB defines Ad Delivered and Client-Confirmed Ad Play with quartile markers through 100%. Use those seats for vendor comparison. Treat high case rates like 98% as format potential, not a mandated floor.
Q: Does IAB publish one average audio completion percentage? A: No public universal average appears in the Podcast Measurement and Getting Audio materials cited here. IAB publishes definitions and case examples. There is no public dataset for a single official industry median.
Q: What is Client-Confirmed Ad Play? A: It counts an ad that prompted a client tracking beacon when played. Whenever possible it includes how much played: start, 25%, 50%, 75%, and 100% complete (Podcast Measurement v2.2).
Q: Why does audio get cited for high completion? A: Many streaming formats are non-skippable or limited-skip, so completion is partly structural. The IAB Coca-Cola streaming case reported 98% completion alongside $6.57 ROAS (IAB Getting Audio).
Q: How should completion inform budget, not just creative? A: Pair completion seats with time-share and mix evidence: ~20% of digital time versus ~2.9% of digital ad revenue, and Neustar’s Auto example of a 1.8% shift lifting overall ROAS 23% (IAB MMM).
An audio completion rate benchmark is a ladder of measurement seats, not a single number on a tip list. Use IAB Ad Delivered and Client-Confirmed quartiles for comparisons. Use named cases like 98% for format proof. Refuse invented industry averages. Then decide whether audio deserves more than ~2.9% of digital ad dollars when it already takes ~20% of digital time.
List products partners can sell on feat.: https://www.feat.press.
LinkedIn KPI benchmarks: Socialinsider 5.20% impression ER and format ladder vs Hootsuite 3.4% follower ER. Lock the denominator first.
Performance marketing KPI benchmarks by channel: WordStream search, Triple Whale Meta 1.88 vs Google 3.27 ROAS, Dreamdata LinkedIn 121%.
How iOS privacy changes affected performance marketing: ATT cut conversion CTR ~37% in research, hurt Meta-heavy Shopify sales, forced MMM and lift tests.