Audio Completion Rate Benchmark Explained
Audio completion rate benchmark is a metric seat: IAB Ad Delivered vs Client-Confirmed (25-100%) plus a 98% streaming case, not a fake industry average.
LinkedIn KPI benchmarks: Socialinsider 5.20% impression ER and format ladder vs Hootsuite 3.4% follower ER. Lock the denominator first.

TL;DR: LinkedIn KPI benchmarks start with the engagement denominator. Socialinsider’s impressions-based average sits at 5.20% with native documents at 7.00%. Hootsuite’s follower-based average sits at 3.4% by industry. Do not average those two. Paid CTR is a separate seat. There is no public LinkedIn-to-affiliate conversion census.
Searchers ask for linkedin kpi benchmarks and get one mashed percentage. That mashup mixes impressions engagement, followers engagement, organic CTR, and paid CTR. Finance then thinks the channel is broken when the real bug is the scoreboard.
Channel KPI context lives in performance marketing KPI benchmarks by channel. Creator pricing lives in influencer marketing rates by follower count and platform. ROI math lives in how brands calculate influencer marketing ROI. This page owns LinkedIn’s denominator-first scorecard.
LinkedIn KPI benchmarks are labeled planning ranges for engagement rate, reach meters, and click-through rate on LinkedIn, always tied to a denominator and a product (organic post vs paid ad). They answer “is this post or campaign in a normal band,” not “will this post mint revenue.”
They are not one universal “good LinkedIn rate.” Socialinsider defines engagement rate by impressions as engagements divided by impressions, times 100, and states that matches LinkedIn’s formula (Socialinsider). Hootsuite’s industry tables and FAQ describe engagement as engagements over followers (or optionally impressions/reach) and publish a 3.4% LinkedIn average in the same June 2026 update (Hootsuite). Same word. Different math.
Operators already feel the split. On a ~2,000-follower B2B company page, Reddit managers call 1-3% healthy and 5%+ a strong angle when the rate is computed against followers (r/SocialMediaManagers). That VOC lines up with Hootsuite’s followers world, not Socialinsider’s impressions world.
LinkedIn KPI benchmarks matter because vanity likes, mixed denominators, and paid/organic mashups produce fake underperformance. Creators and affiliates who treat LinkedIn as a distribution surface need meters that survive a board meeting.
LinkedIn KPI benchmarks work as a LinkedIn KPI Denominator Ladder. Climb in order. Do not jump to industry gossip before you lock the formula.
| Rung | Question | Primary public anchor |
|---|---|---|
| 1. Denominator | Engagement / impressions or / followers? | Socialinsider impressions ER 5.20% vs Hootsuite followers ER 3.4% |
| 2. Format | Which native format lifts ER? | Socialinsider 2025: document 7.00% -> link 3.25% |
| 3. Industry | What followers-ER is normal in my vertical? | Hootsuite: 4.0% construction to 2.0% media |
| 4. Product fork | Organic post or paid ad? | Paid sponsored CTR 0.44%-0.65% (The B2B House); keep separate |
| 5. Distribution | Did the right people click a sell or opt-in surface? | no public dataset for LinkedIn->commission CVR |
Source: Socialinsider LinkedIn Organic Benchmarks; Hootsuite average engagement rates (June 17, 2026); The B2B House LinkedIn ad benchmarks. Do not average rows across denominators.
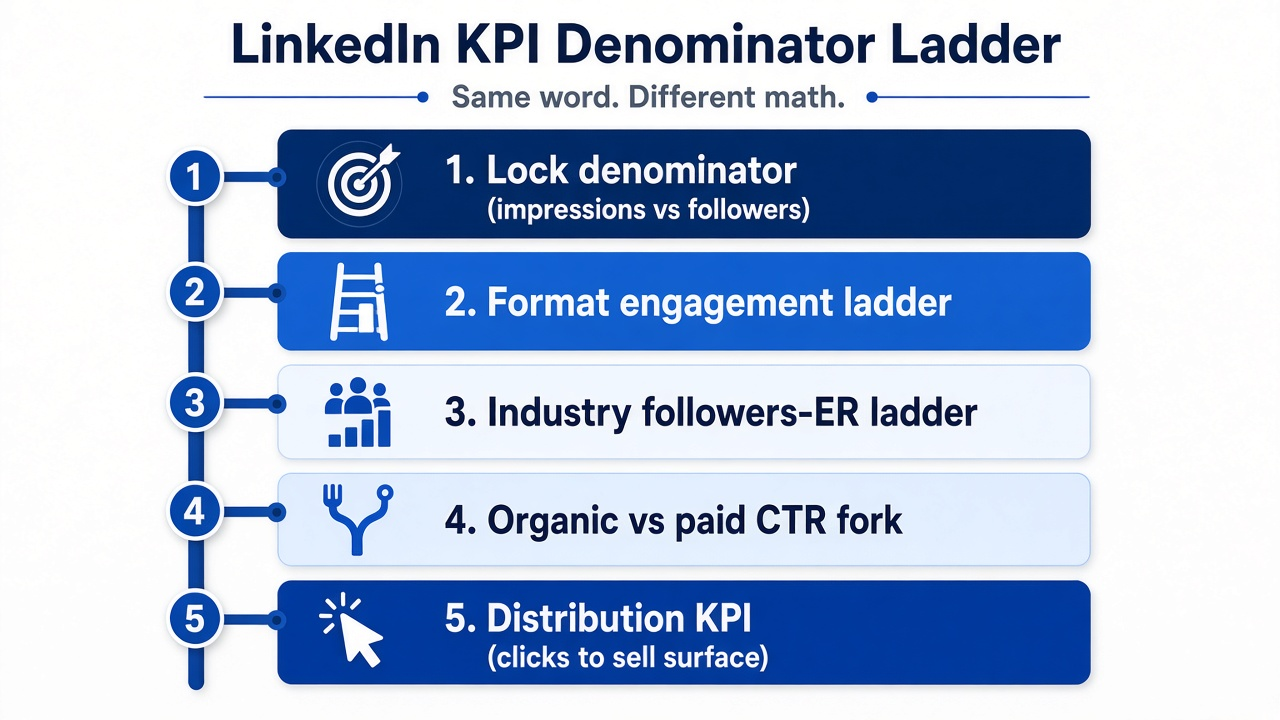
Source: LinkedIn KPI Denominator Ladder synthesized from Socialinsider, Hootsuite, and The B2B House pages cited above. https://www.socialinsider.io/social-media-benchmarks/linkedin - https://blog.hootsuite.com/average-engagement-rate/
Write the formula on the dashboard before you set a target.
| Scorecard | Formula | Labeled overall anchor |
|---|---|---|
| Impressions ER | Engagements / impressions x 100 | Socialinsider 5.20% (+8% YoY) |
| Followers ER | Engagements / followers x 100 | Hootsuite LinkedIn 3.4% |
Source: Socialinsider; Hootsuite.
Hootsuite’s FAQ also says a “good” engagement rate generally falls between 1% and 5%, and that above 3% is strong on Instagram and LinkedIn, while reminding you that the formula can use followers or impressions/reach (Hootsuite). That honesty is the point. Pick one denominator for the meeting.
Socialinsider’s annual table (2025 values published in the 2026 benchmarks page) is the format scorecard. Sample: 1.3M posts, 16,645 business pages, active presence January 2024 through December 2025 (Socialinsider).
| Content format | Avg eng rate 2024 | Avg eng rate 2025 |
|---|---|---|
| Native document | 6.10% | 7.00% |
| Multi image | 6.60% | 6.45% |
| Video | 5.60% | 6.00% |
| Image | 4.85% | 5.30% |
| Text | 4.00% | 4.50% |
| Poll | 4.40% | 4.20% |
| Link | 3.30% | 3.25% |
Source: Socialinsider LinkedIn Organic Benchmarks. Engagement rate by impressions.
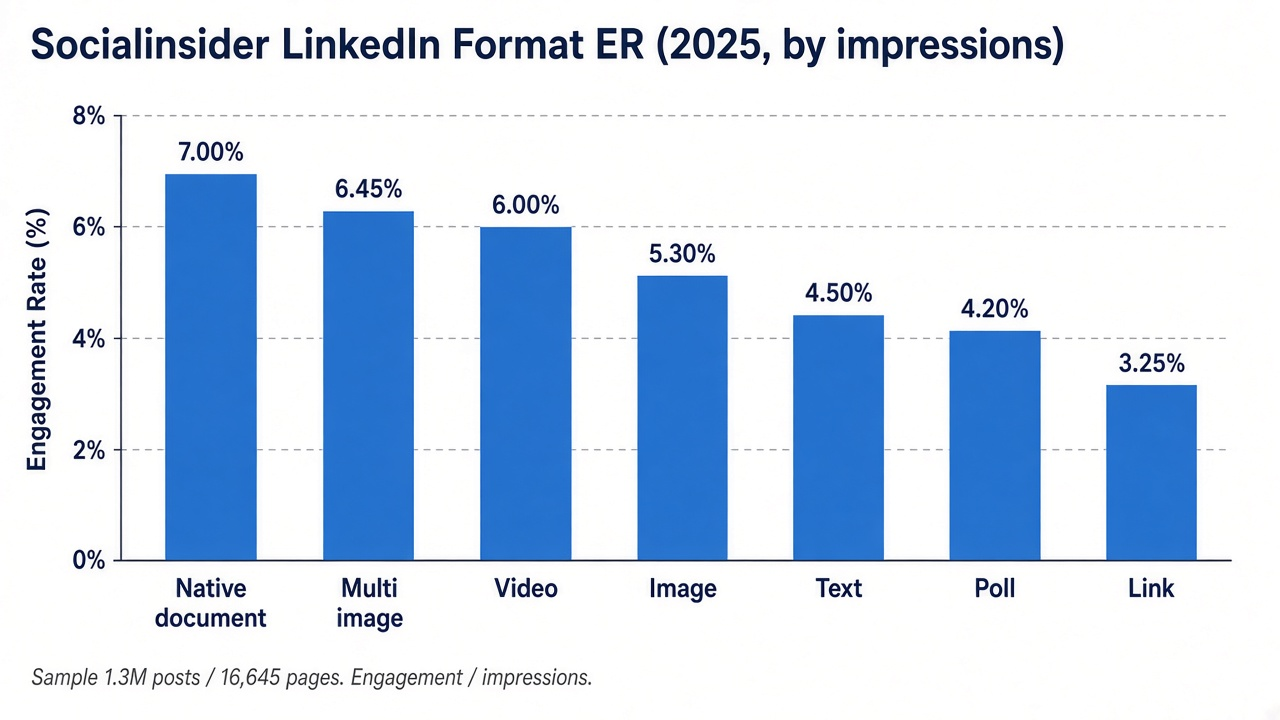
Source: Socialinsider, LinkedIn Organic Benchmarks (2025 column). https://www.socialinsider.io/social-media-benchmarks/linkedin
Link posts sit at the bottom. That matches operator advice to keep the URL out of the post body and put the link in the first comment when you care about in-feed engagement (r/SocialMediaManagers). If the job is clicks to a product page, accept a lower ER and measure CTR and downstream conversion separately.
Socialinsider also publishes Q2 2026 quarterly format rows (for example native documents near 6.60% in that quarter). Do not paste a Q2 cell into the annual table. Label the window.
Hootsuite’s June 17, 2026 update is the industry scorecard for followers-style LinkedIn engagement (Hootsuite):
| Industry | LinkedIn engagement rate |
|---|---|
| Construction, mining, manufacturing | 4.0% |
| Dining, hospitality, tourism | 3.9% |
| Consumer goods and retail | 3.9% |
| Other | 3.8% |
| Marketing agencies | 3.7% |
| Technology | 3.6% |
| Healthcare, pharma, biotech | 3.3% |
| Utilities and energy | 3.3% |
| Financial services | 3.2% |
| Real estate, legal, professional | 3.2% |
| Nonprofit | 3.0% |
| Education | 2.8% |
| Government | 2.7% |
| Media and entertainment | 2.0% |
| Overall LinkedIn | 3.4% |
Source: Hootsuite average engagement rates, June 17, 2026.
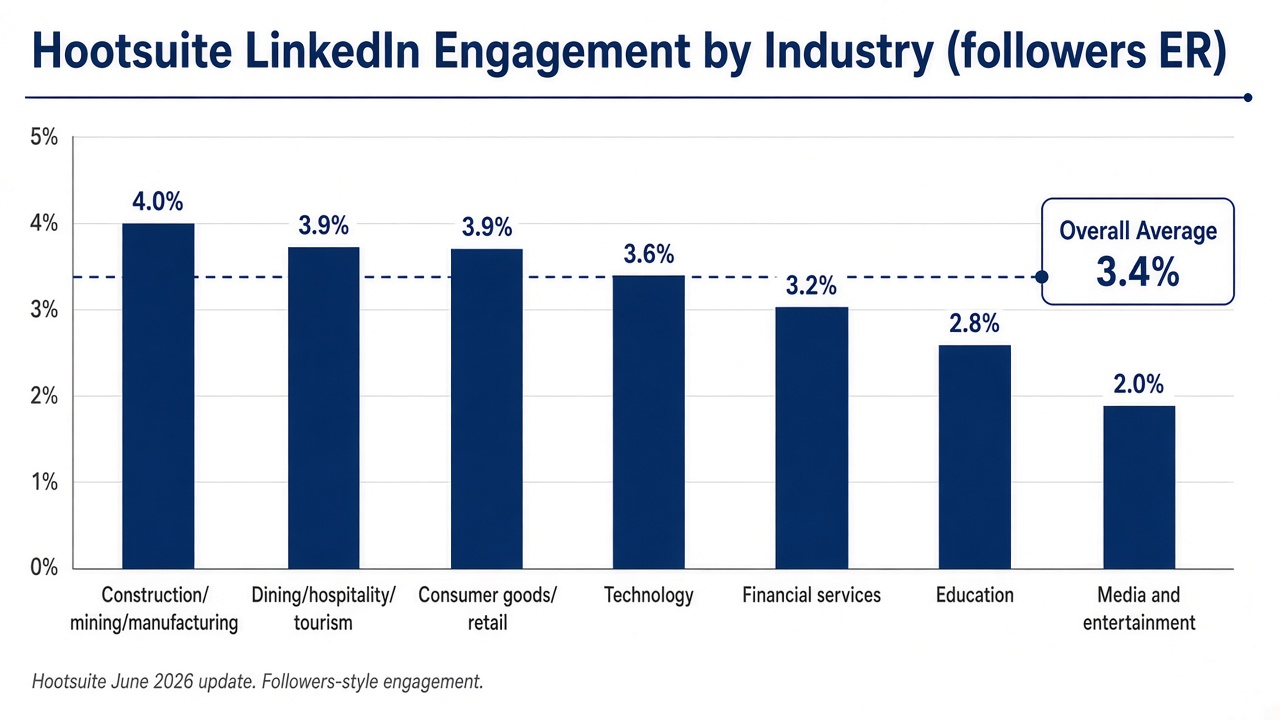
Source: Hootsuite, Average engagement rates for 12 industries (2026 update). https://blog.hootsuite.com/average-engagement-rate/
Use this ladder when your ESP or social tool reports engagement against followers. Do not use it to second-guess a Socialinsider-style impressions ER of 5%.
Engagement rate is not CTR. CTR is clicks divided by impressions (or by LinkedIn’s chargeable-click definition on ads). Keep organic and paid in separate columns.
| Seat | Labeled CTR anchor | Notes |
|---|---|---|
| Paid sponsored content (global avg) | 0.44%-0.65% | The B2B House guide |
| Paid single image | 0.56% | Same guide |
| Paid carousel | 0.40% | Same guide |
| Paid video | 0.44% | Same guide |
| Paid document ad | 0.43% | Same guide |
| Paid event ad | 0.55% | Same guide |
Source: The B2B House LinkedIn Ad Benchmarks. Publisher guide, not a LinkedIn official census. Organic CTR has no matching Socialinsider column in this research pass.
If your organic post’s job is traffic, report CTR and landing conversion beside ER. Do not declare the post a failure because ER looked like a link post while CTR hit the sales page.
For affiliates and creators, the last rung is whether the right people reached a place they can buy. There is no public dataset in this research pass for LinkedIn click-to-commission or LinkedIn-to-storefront conversion across a matched panel. Measure your own: tracked link clicks, storefront sessions, and attributed sales. feat. exists for the sell surface: list the product, let creators promote through co-branded storefronts, and split revenue on the purchase (feat.).
| If your dashboard shows… | Compare to… | Next move |
|---|---|---|
| Engagement / impressions | Socialinsider 5.20% overall; format table | Change format before you change industry narrative |
| Engagement / followers | Hootsuite 3.4% overall; industry row | Judge against your vertical, not construction’s 4.0% |
| Mostly link posts under 3.5% impressions ER | Socialinsider link 3.25% | Expected for link-outs; add a document/carousel version |
| Paid CTR near 0.5% | The B2B House 0.44%-0.65% | Normal paid band; optimize creative, not organic ER targets |
| High ER, no pipeline | Your CRM / storefront analytics | Add a tracked sell surface; ER alone is not revenue |
Q: What are LinkedIn KPI benchmarks? A: They are labeled ranges for LinkedIn engagement rate, related reach meters, and CTR, always tied to a denominator and to organic vs paid. Socialinsider’s impressions-based average is 5.20%. Hootsuite’s followers-based LinkedIn average is 3.4%. Do not treat those as one number.
Q: What is a good LinkedIn engagement rate? A: On an impressions scorecard, Socialinsider’s overall average is 5.20%, with native documents near 7.00%. On a followers scorecard, Hootsuite’s overall average is 3.4%, and operators often call 1-3% healthy for small B2B company pages. Lock the formula before you call a rate good or bad.
Q: How do LinkedIn engagement rates differ by post format? A: Socialinsider’s 2025 format column ranks native documents highest at 7.00%, then multi-image 6.45%, video 6.00%, image 5.30%, text 4.50%, poll 4.20%, and link posts lowest at 3.25%. Link-outs trade engagement for clicks.
Q: How do LinkedIn engagement rates differ by industry? A: Hootsuite’s June 2026 update ranges from 4.0% in construction, mining, and manufacturing to 2.0% in media and entertainment, with an overall LinkedIn average of 3.4%. Use that ladder only on a followers-style engagement rate.
Q: Should I use the same KPI for organic LinkedIn posts and LinkedIn ads? A: No. Organic engagement rate and paid CTR are different products. The B2B House publishes sponsored-content CTR near 0.44%-0.65% globally. Report paid CTR beside cost meters, not against Socialinsider’s organic engagement table.
LinkedIn KPI benchmarks are a denominator problem first. Use Socialinsider’s 5.20% impressions ER and format ladder when your tool divides by impressions. Use Hootsuite’s 3.4% industry ladder when you divide by followers. Keep paid CTR in its own column. When the real job is selling, measure clicks into a storefront and attributed sales, and list the offer on feat. so creators can sell through co-branded pages.
Audio completion rate benchmark is a metric seat: IAB Ad Delivered vs Client-Confirmed (25-100%) plus a 98% streaming case, not a fake industry average.
Performance marketing KPI benchmarks by channel: WordStream search, Triple Whale Meta 1.88 vs Google 3.27 ROAS, Dreamdata LinkedIn 121%.
How iOS privacy changes affected performance marketing: ATT cut conversion CTR ~37% in research, hurt Meta-heavy Shopify sales, forced MMM and lift tests.