Whitelisted Ads Explained (Naming Ladder)
Whitelisted ads means creator-handle paid. Map slang to Meta Partnership Ads and TikTok Spark Ads, separate usage rights, price the window.
Influencer attribution vs paid media is a confidence ladder: IAB n=453 (platform 55%, MTA 25%, MMM 29%), Google lift + MMM. Not a fake reliability %.

TL;DR: Influencer marketing attribution vs paid media is a confidence ladder, not a morality score. IAB’s 2025 creator survey (n=453) shows brands still lean on ad platform reporting (55%) while only 25% use MTA and 29% use MMM for creator KPIs. Paid media looks cleaner because the seller owns the meter. Creators look broken under last-click. Compare seats, not vanity ROAS.
Finance asks why Meta ROAS looks sharp and the creator line looks soft. The board hears “attribution is broken” and cuts the creator budget. That is usually a meter mismatch, not proof creators do nothing.
Influencer marketing attribution vs paid media only becomes useful when you separate trace density from causal truth. Paid platforms ship native conversion reports. Creator journeys leak across Stories, dark social, branded search, and a retargeting closer. Forcing both onto last-click makes creators lose by design.
Sibling pages own nearby jobs: influencer marketing vs paid ads for channel ROI indexes, how brands calculate influencer marketing ROI for the cost formula, attribution models compared for last-click / MTA / MMM, and incrementality testing explained for causal lift. This page owns reliability: which meter you are allowed to trust for which decision.
Influencer marketing attribution vs paid media is the comparison of how confidently you can assign conversions, revenue, or lift to creator partnerships versus to paid ad inventory on platforms such as Meta, Google, and TikTok Ads.
Paid media attribution usually starts inside the platform that sold you the click or view. Influencer attribution usually starts with a thinner first-party stack: unique links, promo codes, UTMs, storefront checkouts, post-purchase surveys, and later brand-search or MMM signals. Whitelisting and Spark Ads sit in the middle: creator creative running as paid inventory, so you inherit paid meters with creator rights costs (see whitelisting and Spark Ads explained).
Reliability here does not mean “the spreadsheet feels tidy.” It means: does this number answer the question you are actually asking (ops pacing, journey credit, or causal lift)?
Creator spend is large enough that measurement theater gets expensive. IAB projects U.S. creator economy ad spend at about $37.1B in 2025, up 26% from $29.5B in 2024, roughly 4× faster than broader media growth of +5.7% (IAB). When that money hits a last-click report, creators lose political fights they should not lose.
Operators on Reddit say the quiet part out loud: comparing influencer ROI to Facebook ad ROI under last-click is apples to oranges, and the Story-to-Google-to-paid-closer path makes good creators look idle (r/influencermarketing).
| Challenge (top-3 selection) | Share of brands (IAB n=453) |
|---|---|
| Proving ROI | 39% |
| Attributing sales to creators | 34% |
| Tracking long-term impact / loyalty | 32% |
| Attributing brand lift to creators | 31% |
| Incorporating creator results in MMMs | 28% |
| Comparing ROI to other channels | 26% |
Source: IAB × Advertiser Perceptions, 2025 Creator Economy Ad Spend & Strategy Report (n=453). https://www.iab.com/wp-content/uploads/2025/11/IAB_Creator_Ad_Spend_and_Strategy_Report_2025.pdf
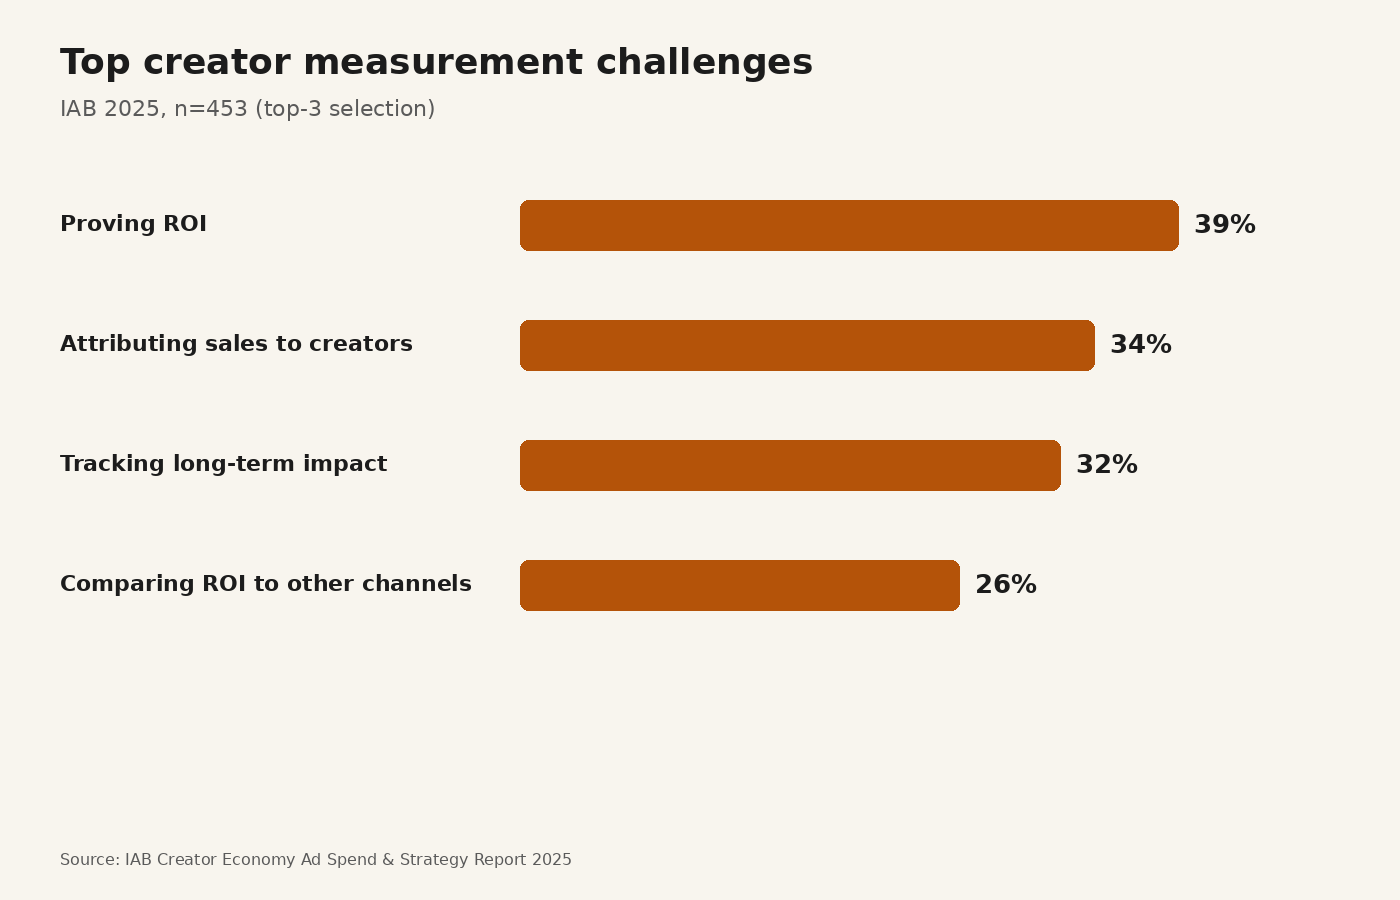
Source: IAB × Advertiser Perceptions, 2025. https://www.iab.com/wp-content/uploads/2025/11/IAB_Creator_Ad_Spend_and_Strategy_Report_2025.pdf
Influencer marketing attribution vs paid media works when you place each channel on the same Attribution Confidence Ladder, then refuse to crown a winner from mismatched rungs. Paid media owns denser click and view traces. Creators own slower demand creation that often closes elsewhere. Reliability rises as you move from seller dashboards toward experiments and portfolio models.
Five seats, one sale:
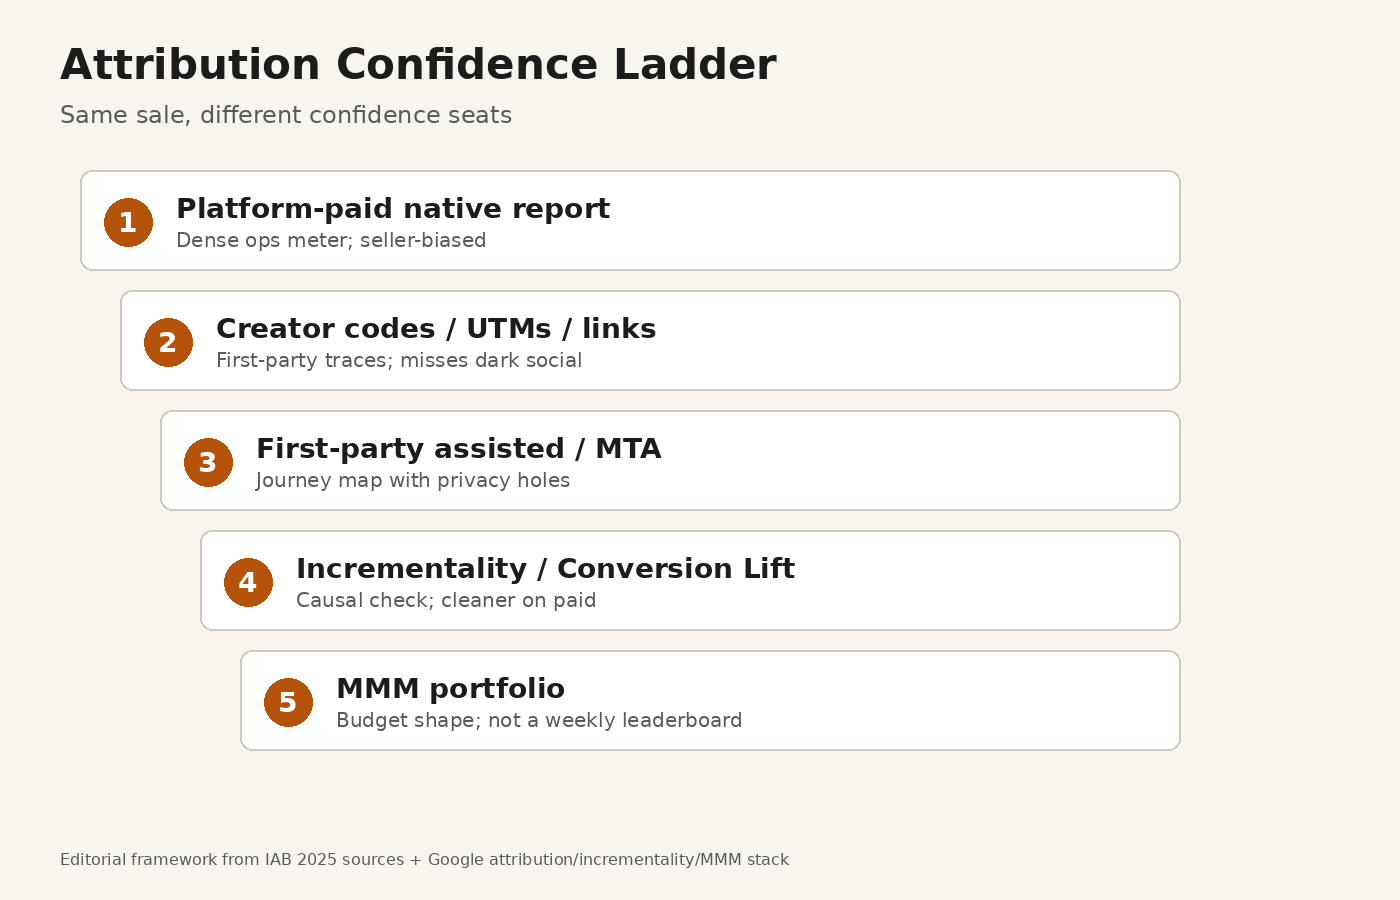
Source: Editorial framework synthesizing IAB 2025 measurement sources with Google Ads Help on attribution, incrementality, and MMM. https://www.iab.com/wp-content/uploads/2025/11/IAB_Creator_Ad_Spend_and_Strategy_Report_2025.pdf · https://support.google.com/google-ads/answer/16719772
Paid media attribution feels trustworthy because the auction platform records the interaction and reports the conversion in one product. That density is real. It is also incomplete. Platform models still overclaim when multiple channels touch the same buyer. Google’s own guidance is not “trust the column”: combine attribution (journey map), incrementality (causal check), and MMM (portfolio view) (Google Ads Help). A Google/BCG sample of senior marketing analytics professionals (n=567, U.S., annual ad spend above $500k) found 80% say implementing insights from incremental experiments has a high impact on revenue growth (Google Ads Help).
If your paid ROAS is uncalibrated by lift tests, you are not holding creators to a higher standard. You are holding creators to a denser fiction.
Creator demand often starts where clicks are optional. Someone watches a Story, searches the brand days later, then converts on a branded search ad or a retargeting unit. Last-click pays the closer. The creator’s row looks dead. Unique codes and UTMs recover the cooperative buyers. Post-purchase “how did you hear about us” surveys recover more dark social. None of that produces a universal miss-rate census, so do not invent one.
IAB’s source mix shows the industry still measuring creators inside platform silos:
| Primary source for creator KPIs | Share (IAB n=453) |
|---|---|
| Ad platform reporting | 55% |
| Internal / 1P analytics | 49% |
| Creator-provided reporting | 39% |
| MMM | 29% |
| MTA | 25% |
Source: IAB × Advertiser Perceptions, 2025 Creator Economy Ad Spend & Strategy Report (n=453). https://www.iab.com/wp-content/uploads/2025/11/IAB_Creator_Ad_Spend_and_Strategy_Report_2025.pdf
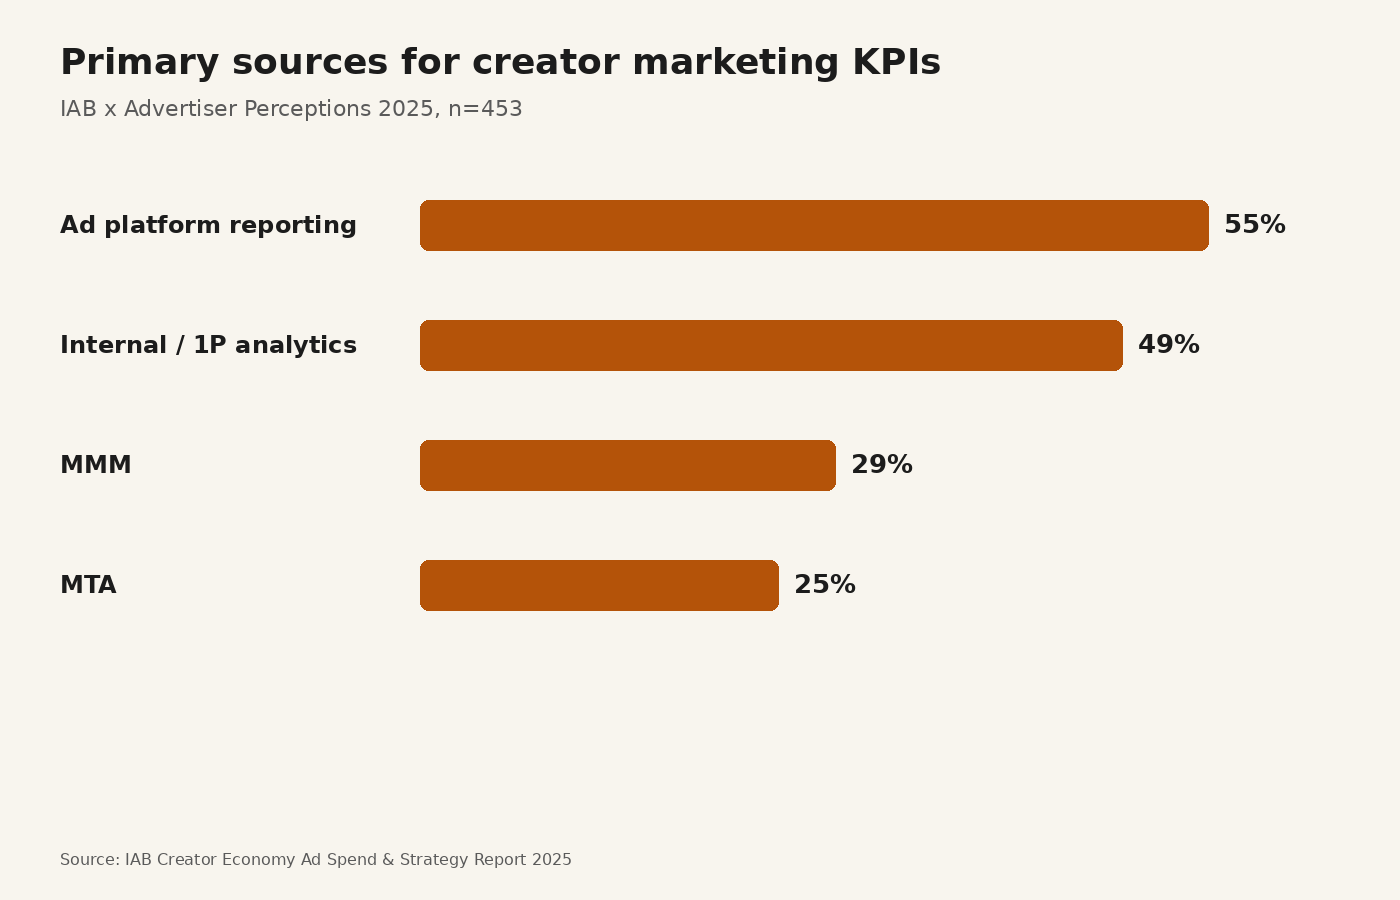
Source: IAB × Advertiser Perceptions, 2025. https://www.iab.com/wp-content/uploads/2025/11/IAB_Creator_Ad_Spend_and_Strategy_Report_2025.pdf
| Decision | Prefer this seat | Do not use alone |
|---|---|---|
| Daily creative pacing on paid | Platform-paid report | MMM |
| Creator leaderboard for tracked sales | Codes + UTMs + storefront / affiliate checkouts | Platform view-through only |
| Journey credit across digi touches | 1P assisted / MTA | Last-click |
| “Did this cause incremental sales?” | Incrementality / geo or user lift | Uncalibrated ROAS |
| Quarterly budget split across channels | MMM calibrated by lift | Creator vanity ER |
Channel ROI indexes (IPA short-term influencer 99 vs paid social 86, long-term 151 vs 77) live on the sibling influencer vs paid ads page. Do not paste those indexes into an attribution reliability claim. They answer effectiveness under IPA’s method, not click-trace density on your Shopify admin.
Whitelisting, Partnership Ads, and Spark Ads move creator assets onto paid meters. Measurement gets denser. Cost accounting gets heavier: usage rights, media spend, and organic fee are separate line items. Treat the paid amplification report as paid media attribution with a creator origin story, not as proof the organic post’s last-click was fair.
Q: How reliable is influencer marketing attribution compared to paid media attribution? A: Paid media attribution is usually denser because platforms record the interaction and the conversion in one system. Influencer attribution is usually thinner because demand often closes later through search, direct, or paid. Neither is automatically causal. Use the Attribution Confidence Ladder and calibrate with incrementality and MMM before you crown a winner.
Q: Why does last-click make influencers look worse than paid ads? A: Creators often introduce the brand; paid search or retargeting often closes. Last-click pays the closer. That pattern is structural, not proof the creator added zero value. Codes, assisted paths, surveys, and lift tests recover different parts of the truth.
Q: What do brands actually use to measure creator KPIs? A: In IAB’s 2025 sample (n=453), 55% cite ad platform reporting and 49% cite internal / first-party analytics as primary sources, while only 29% cite MMM and 25% cite MTA (IAB).
Q: Can incrementality testing work for influencer campaigns the way it does for Google Ads? A: Causal tests are clearer when you can hold out delivery, which paid media often can. Organic creator posts usually need geo stagger, timed pauses, or portfolio MMM instead of a clean user holdout. Google’s Conversion Lift floors near $5,000 apply to eligible Google Ads studies, not to every creator post (Google Ads Help).
Q: Is there a standard “% less reliable” number for influencer attribution versus paid media? A: No. There is no public dataset for a universal reliability gap percentage. Treat that claim as invented. Compare measurement seats and named challenge rates (IAB proving ROI 39%, attributing sales 34%) instead.
Influencer marketing attribution vs paid media is a fight about meters. Platform-paid reports are dense and seller-shaped. Creator traces are thinner and slower. Climb the Attribution Confidence Ladder before you let last-click fire a channel that is creating demand for someone else’s closer. If you want sellers on tracked, co-branded storefronts instead of dark-social hope, list on feat..
Whitelisted ads means creator-handle paid. Map slang to Meta Partnership Ads and TikTok Spark Ads, separate usage rights, price the window.
Diagnose a flatlined influencer agency: fee markups, vanity KPIs, one-off treadmill, missing owned seats, and when to add storefront distribution.
Most marketers see under half of gifted creators post. Plan stock loss as majority silent inventory, then cut ghosts with opt-in and prune rules.