SaaS PPC Landing Page Conversion Rates (2026)
SaaS PPC landing conversion rates: Unbounce SaaS 3.8%, WordStream Business Services 5.14%, First Page Sage PPC 0.7%; meters differ.
PowerReviews 2022 sites show a 3.8% served-UGC lift and 108.6% when shoppers interact. Reliance Ladder. Not a store forecast.

TL;DR: Can retailers rely on PowerReviews for a conversion forecast? Use it as a meter, then test your PDP. On PowerReviews sites in 2022, served UGC lined up with a 3.8% lift and ratings-and-reviews interaction with 108.6%. The sample is PowerReviews customers, a 24-hour visitor, and a self-selected click.
Finance will ask whether the review vendor’s slide is a plan or a brochure. Can retailers rely on PowerReviews when the deck leads with a number above 100%? The short version: rely on the split between a small served-content association and a large interaction association. Build the forecast on your own product page.
The lift ladder itself lives on product reviews conversion rate impact. Page-level baselines live on product page conversion rate benchmarks. This page owns the reliability question.
Relying on PowerReviews means treating its published conversion associations as a labeled meter for shoppers on PowerReviews product pages, then keeping those percentages out of a forecast for a different stack. The meter is usable inside that sample. It becomes a brochure when someone copies it onto a review app they have not measured.
The 2023 edition is an observational cut of sites that already run the vendor’s display analytics. Baseline conversion in 2022 was 3.2% of visitors. Shoppers who scrolled far enough to receive a UGC impression converted at 3.3% (3.8% lift). Shoppers who interacted converted at 6.4% (102.4% lift) (PowerReviews).
That gap is the product. A retailer who quotes only 108.6% has skipped the meter that matters: most of the association shows up after a click, a filter, a photo open, or a vote. The UGC marketing benchmarks page keeps social-content multiples in their own lane so they do not get averaged into this PDP meter.
Can retailers rely on PowerReviews when a budget meeting treats 100% lift as the expected gain from turning reviews on? The served figure says the gain from merely reaching body content is a few percent on these sites. The interaction figure says shoppers who already touch the module convert much higher. Those are different decisions.
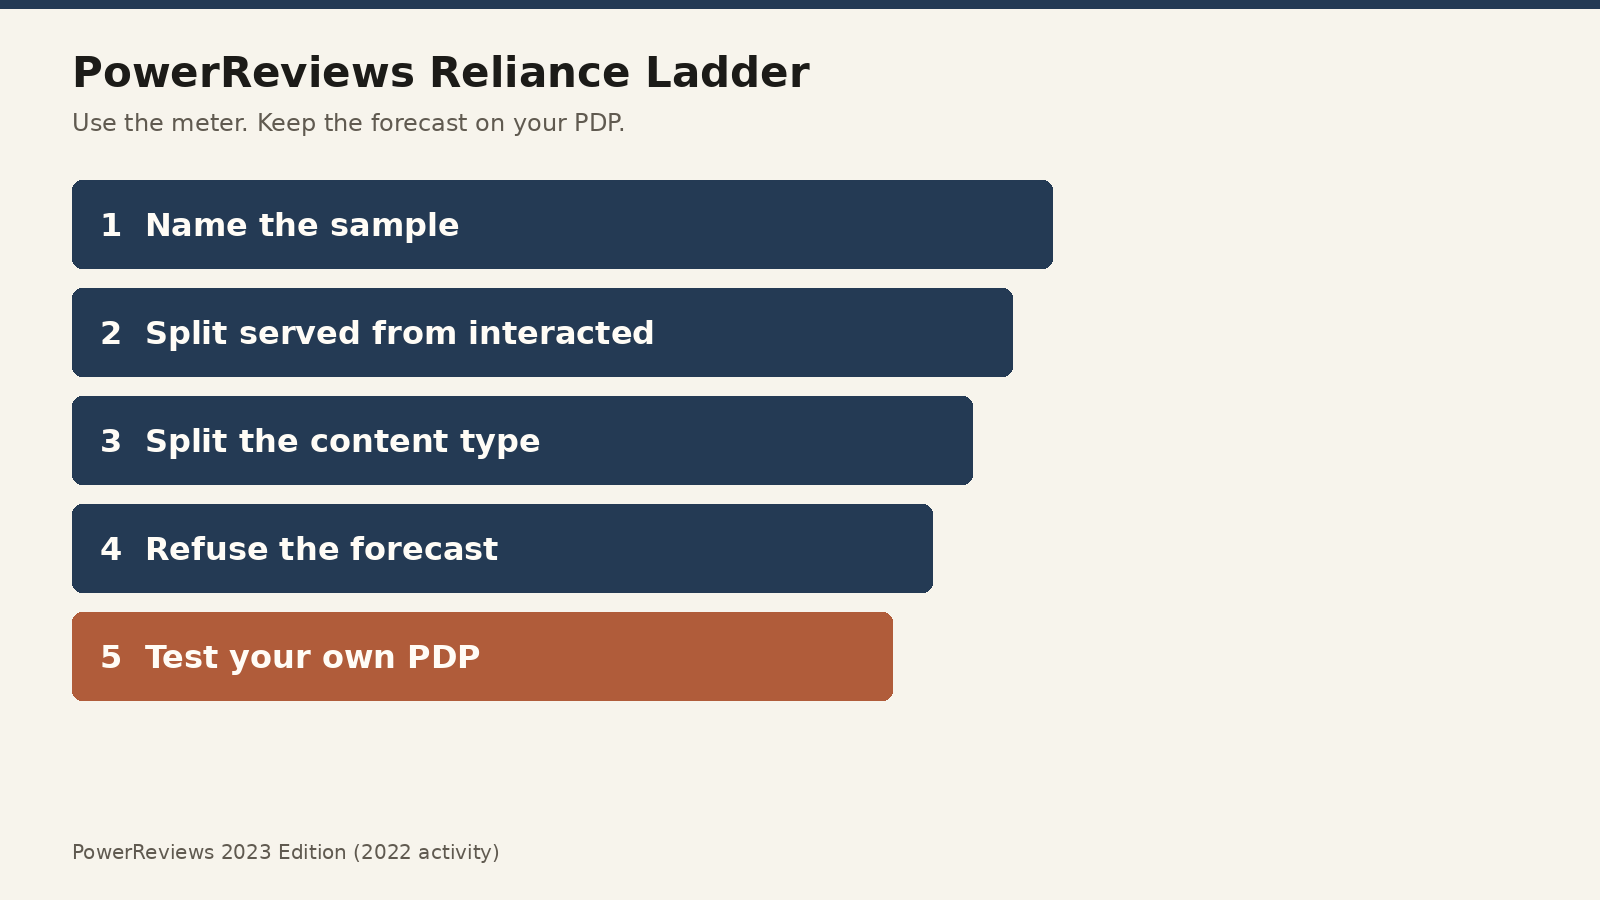
Source: Editorial Reliance Ladder from PowerReviews, How UGC Impacts Conversion: 2023 Edition. https://www.powerreviews.com/how-ugc-impacts-conversion-2023/
| Year | Visitor CVR | Served UGC CVR | Served lift | Interaction CVR | Interaction lift |
|---|---|---|---|---|---|
| 2020 | 3.4% | 3.6% | 4.3% | 7.2% | 108.4% |
| 2021 | 2.8% | 3.1% | 8.5% | 5.7% | 100.6% |
| 2022 | 3.2% | 3.3% | 3.8% | 6.4% | 102.4% |
Source: PowerReviews, How UGC Impacts Conversion: 2023 Edition. https://www.powerreviews.com/how-ugc-impacts-conversion-2023/
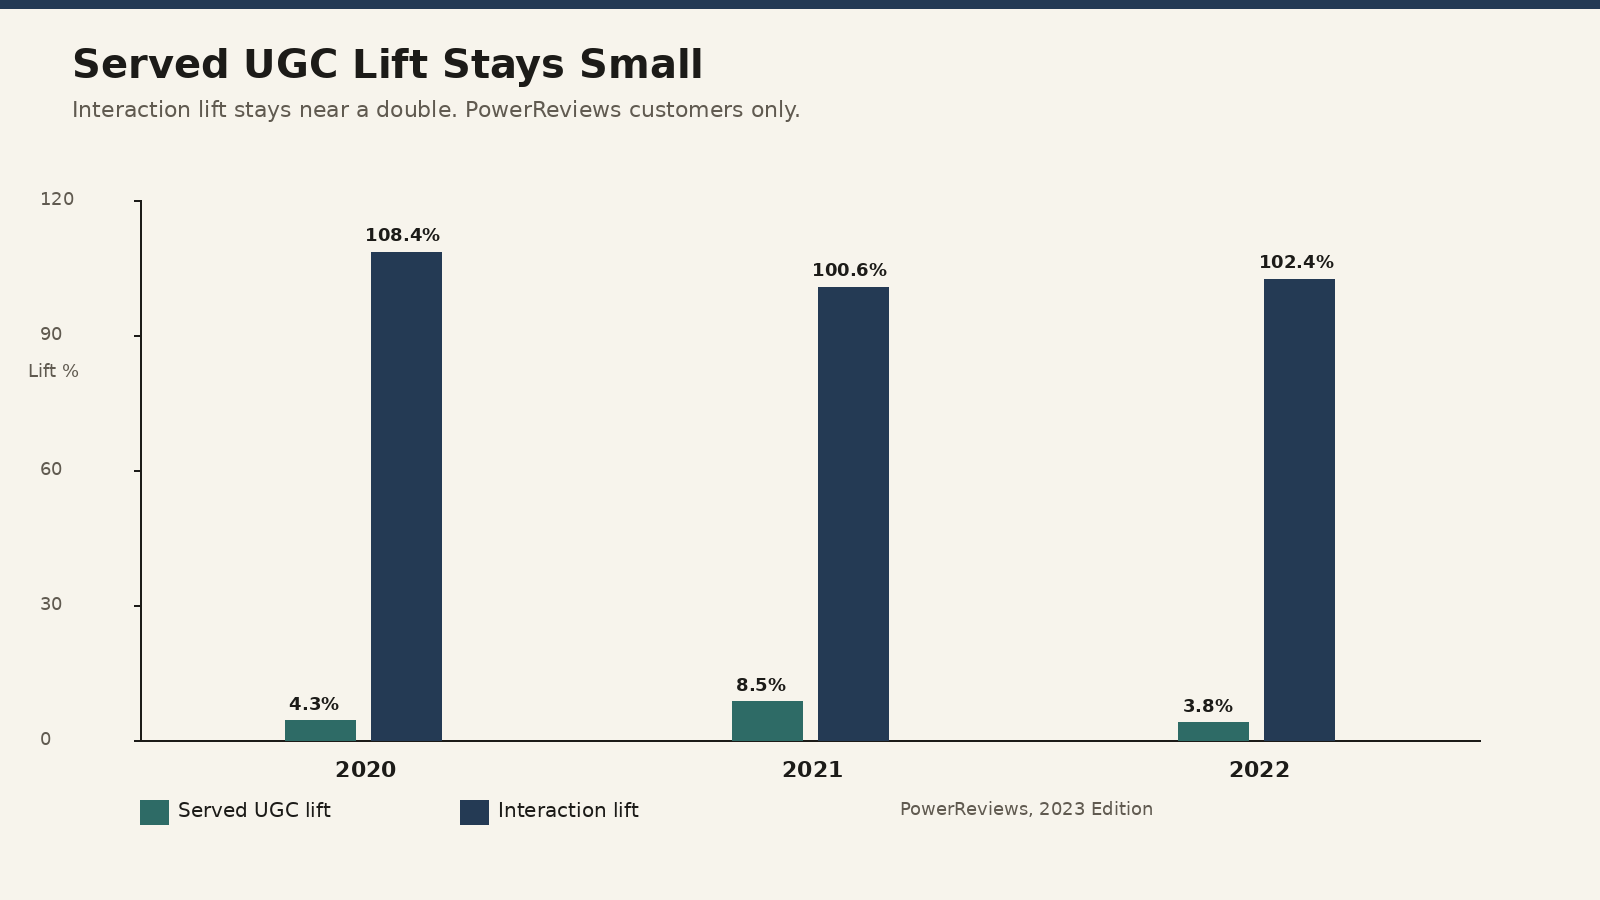
Source: PowerReviews, 2023. https://www.powerreviews.com/how-ugc-impacts-conversion-2023/
How can retailers rely on PowerReviews for a plan number? Walk the Reliance Ladder in order. Name the sample, split served from interacted, split the content type, and keep the percentage off the annual plan until your own PDP test agrees.
Checkout math still belongs on checkout conversion rate benchmarks. A review module does not repair a broken payment step.
PowerReviews defines a UGC impression as a unique visitor who scrolled far enough to be served at least one of reviews, Q&A, or imagery. The top-of-page snippet does not count. An interaction includes clicks such as “read more,” opening a shopper photo, or searching inside reviews (PowerReviews).
In 2022 that produced 3.8% versus 102.4%. A merchant who “turns reviews on” and expects the interaction number has bought the wrong rung. Turning the module on is closer to the served rung, and on these sites the served rung is small because the star summary was already on the page.
The 2022 content-type cuts, all interaction lifts on the same report:
| What the shopper did | Conversion lift |
|---|---|
| Any UGC interaction | 102.4% |
| Photos and videos | 103.9% |
| Ratings and reviews | 108.6% |
| Q&A | 177.2% |
| Helpful Yes vote | 356.3% |
| Helpful No vote | 271.9% |
| Review search | 271.9% |
Source: PowerReviews, How UGC Impacts Conversion: 2023 Edition. https://www.powerreviews.com/how-ugc-impacts-conversion-2023/
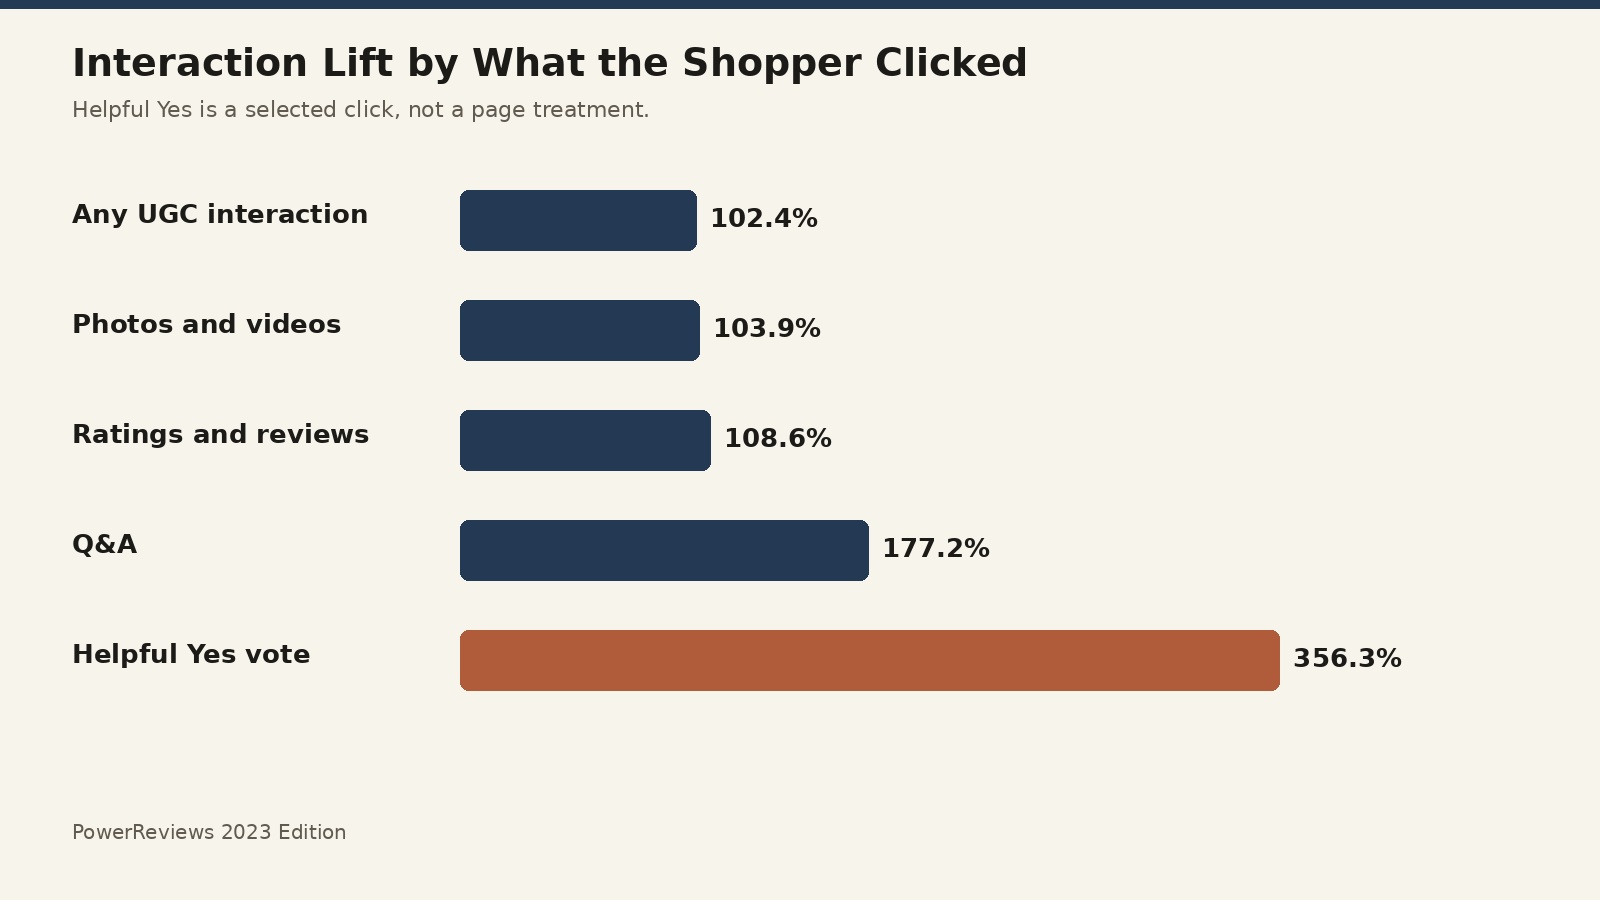
Source: PowerReviews, 2023. https://www.powerreviews.com/how-ugc-impacts-conversion-2023/
Q&A outruns plain review reading. Helpful Yes outruns Q&A by a wide margin. Read the tall bar as a selected shopper, the person who bothers to vote, sitting next to a purchase. It is a weak brief for “add a helpful button and triple conversion.”
Negative reviews are part of the same file. 61.3% of shoppers who use the star filter go to one-star content, and those one-star-only viewers still show a 71.9% conversion lift in this cut (PowerReviews). Hiding every complaint to protect a perfect average fights the behavior the report actually measured.
Spiegel’s 2017 ebook, built with PowerReviews data, puts purchase likelihood peaking at an average of 4.2-4.5 stars, with five reviews tied to 270% greater purchase likelihood versus none (Spiegel Research Center). PowerReviews’ later funnel article says the sweet spot is 4.75-4.99 stars “per a recent report,” and it does not name that report on the page (PowerReviews).
Do not average 4.2 and 4.9 into a house target. One figure is a named, older observational study. The other is an unnamed citation on a vendor essay. The sibling page keeps the Spiegel first-five ladder. This page’s rule is simpler: if the study is unnamed, it does not enter the forecast.
The funnel article also repeats a 292.6% lift when a product displays 5,000+ reviews (PowerReviews). Volume and interaction are different rungs. A catalog of 12 reviews will not inherit the 5,000-review band.
| Decision | Usable PowerReviews figure | Keep out of the model |
|---|---|---|
| Is body UGC worth scrolling to? | 2022 served lift 3.8% on PowerReviews PDPs | A promise that any widget matches it |
| Do interactors convert higher? | 102.4% any UGC, 108.6% ratings and reviews, 177.2% Q&A | Treating the click as a treatment you applied |
| Will one-star filters scare buyers? | 71.9% lift on one-star-only viewers in this cut | Deleting critical reviews to force 5.0 |
| What star average should we target? | Test your distribution | Averaging Spiegel 4.2-4.5 with an unnamed 4.75-4.99 |
| What will our CVR do after we install a tool? | Your PDP test | Any of the percentages above |
Community threads argue the same split in plainer words. One ecommerce comment says generic or imported widgets perform much worse than native, relevant reviews (r/ecommerce). Another says photo reviews matter more than star ratings and warns against stacking trust widgets (r/ecommerce). A dropshipping thread prefers launching with no widget over an empty block or invented names (r/dropshipping). Those are anecdotes. They match the report’s structure: authentic on-page content and real interaction, not a borrowed percentage.
Q: Can retailers rely on PowerReviews to forecast conversion? A: Rely on it to separate a 3.8% served-UGC association from a 108.6% ratings-and-reviews interaction association on PowerReviews sites in 2022. Put your own PDP test in the forecast. The report’s sample is visitors on pages that already run PowerReviews display analytics.
Q: What is the difference between served UGC lift and interaction lift? A: Served lift compares visitors who scrolled into body UGC with the visitor baseline. Interaction lift compares visitors who clicked, opened, filtered, or searched that content. In 2022 those lifts were 3.8% and 102.4%. The top-of-page star snippet is excluded from the served metric.
Q: Does the 108.6% ratings-and-reviews lift apply off PowerReviews? A: The 108.6% figure is the 2022 interaction association inside the PowerReviews sample of 1.5 million pages. There is no public dataset that repeats the same cut on every other review app. Use the direction (interactors convert higher) and measure your stack.
Q: Which star rating does the PowerReviews material say converts best? A: Two public lines disagree. Spiegel’s 2017 ebook peaks at 4.2-4.5 stars. A PowerReviews funnel article says 4.75-4.99 and does not name the study. Do not blend them. Test the distribution you can actually collect.
Q: Is the PowerReviews conversion study an A/B test? A: It is an observational analysis of 2020, 2021, and 2022 behavior on PowerReviews product pages, with a 24-hour visitor definition. Shoppers who interact choose to interact. That is a strong association and a weak estimate of what happens if you only install a widget.
Can retailers rely on PowerReviews? Yes, as a labeled meter: small served-content association, large interaction association, PowerReviews customers only, three years in a row. The 108.6% ratings figure and the 356.3% Helpful Yes figure describe shoppers who already touched the module. Your forecast is the test on the PDP you ship.
List the product where creators can sell it with you: feat..
SaaS PPC landing conversion rates: Unbounce SaaS 3.8%, WordStream Business Services 5.14%, First Page Sage PPC 0.7%; meters differ.
Pages per visit benchmark: Littledata Shopify median 2.7, fashion 3.5, Contentsquare ecommerce p50 2.8. Match the job. Refuse one universal good.
Forced ranking of HubSpot, OptinMonster, Sumo, and Poptin for exit-intent popups by job seat and plan gates, not invented conversion rates.