SaaS PPC Landing Page Conversion Rates (2026)
SaaS PPC landing conversion rates: Unbounce SaaS 3.8%, WordStream Business Services 5.14%, First Page Sage PPC 0.7%; meters differ.
Pages per visit benchmark: Littledata Shopify median 2.7, fashion 3.5, Contentsquare ecommerce p50 2.8. Match the job. Refuse one universal good.

TL;DR: A pages per visit benchmark is a job label first. Littledata’s 427 Shopify stores show a median 2.7 pages per session. Contentsquare’s 2024 ecommerce cut sits at p50 2.8. Fashion runs hotter. A one-page content win can sit low on purpose. Refuse one universal “good” number.
Dashboards treat pages per visit like a scoreboard. More pages must mean more interest. That story collapses the second you mix a help article, a Shopify catalog, and a React SPA into one average.
A pages per visit benchmark is useful when you name the job, pick a sample that matches your stack, and read the median band before you chase a fake crown. It sits next to product page conversion rate benchmarks, checkout conversion rate benchmarks, and mobile vs desktop conversion rate gap.
A pages per visit benchmark is a published distribution of average pages viewed per session (page views divided by sessions) for a labeled sample of sites, so you can place your own number without inventing a industry-wide target.
Similarweb defines the metric as total pageviews divided by total visits in a period (Similarweb). Littledata computes it store by store from GA4 over 90 days, then ranks the stores (Littledata). The label matters more than the formula. Shopify session depth is not a media publisher’s depth, and a single-page FAQ that answers the query is not a failed funnel.
Pages per visit benchmark matters because teams waste sprint time chasing depth that fights the job. A content page that resolves the search is allowed to be shallow. A catalog that never earns a second page may have a discovery problem. Those are different fixes. Without a labeled sample, a founder will treat a fashion median like a food-and-beverage target, or treat a help-center URL like a Shopify browse path. The Job Ladder exists so you stop optimizing the wrong surface.
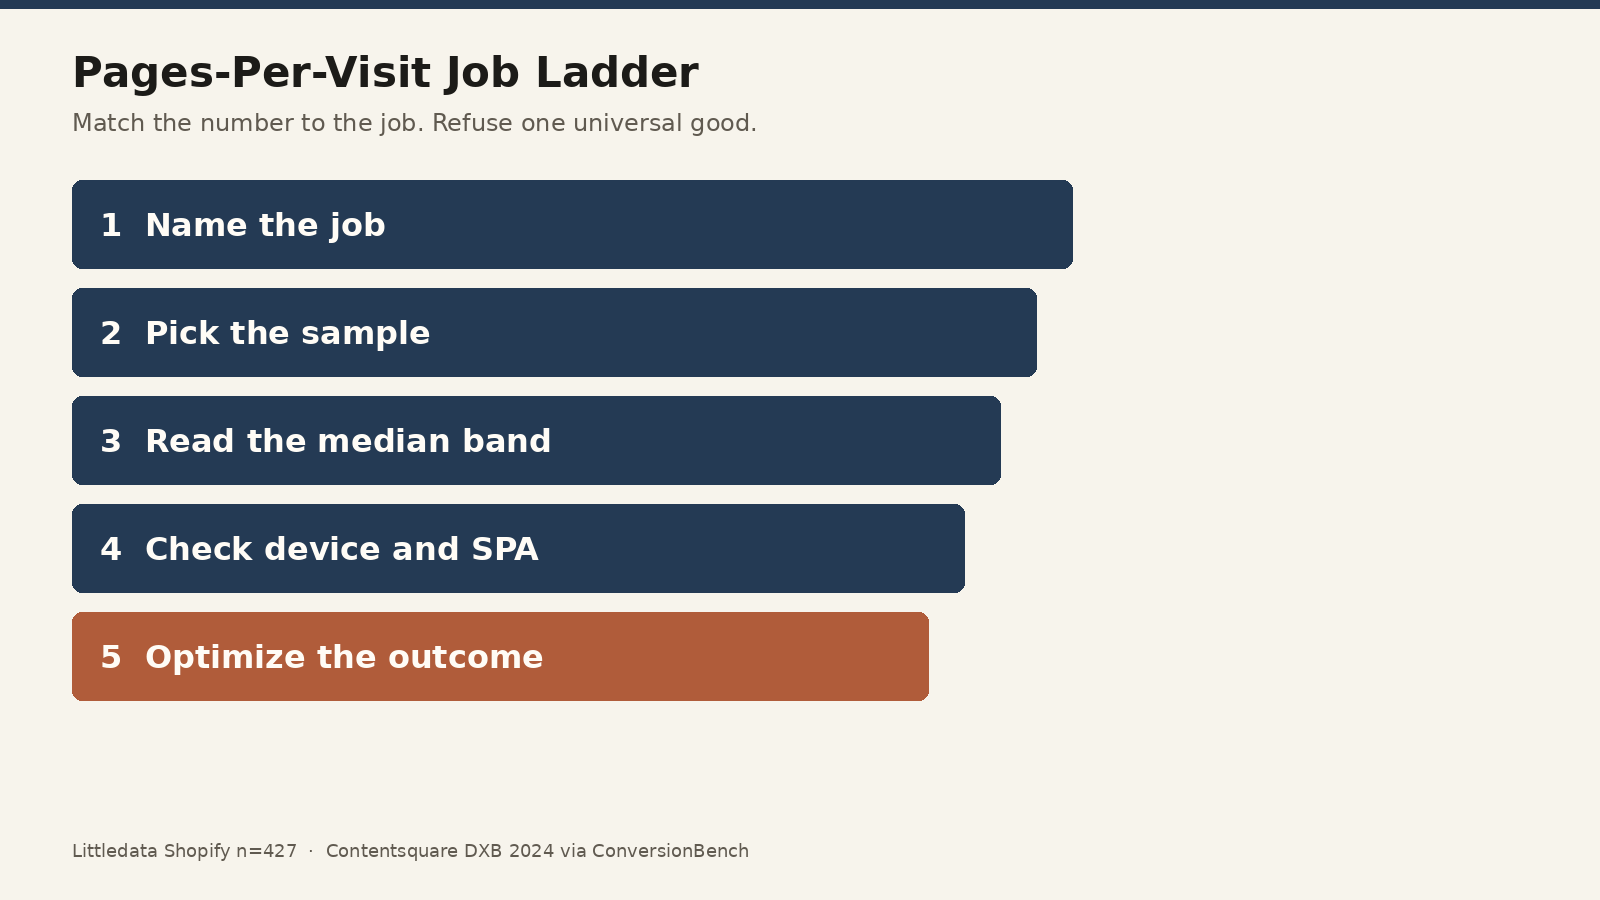
Source: Editorial Pages-Per-Visit Job Ladder from Littledata Shopify benchmarks and Contentsquare DXB 2024 percentiles via ConversionBench. https://www.littledata.io/benchmarks/pages-per-session · https://conversionbench.com/benchmark/pages-per-session/ecommerce
How a pages per visit benchmark works is a Pages-Per-Visit Job Ladder. Name what the session is for, pick a sample that matches your stack, read the median and percentile band, check device and SPA instrumentation, then optimize the outcome that pays (order, lead, return), not the page count itself.
Littledata’s Jul 13 to Oct 10, 2026 window (generated Oct 14, 2026) ranks 427 Shopify stores that send GA4 through Littledata (Littledata):
| Segment | Median pages / session | Top 20% at or above |
|---|---|---|
| All Shopify stores | 2.7 | 4.1 |
| Fashion and Apparel | 3.5 | 5.4 |
| Home and Furniture | 2.8 | 3.6 |
| Beauty and Skincare | 2.4 | 4.7 |
| Health and Supplements | 2.1 | 3.3 |
| Food and Beverage | 2.1 | 3.0 |
Source: Littledata, Pages per Session Benchmark for Ecommerce. https://www.littledata.io/benchmarks/pages-per-session
Across all stores, bottom 10% sits at 1.4, bottom 20% at 1.7, top 10% at 5.3 (Littledata). That spread is the useful part. The gap between a struggling store and a deep browser is larger than the gap between two industry averages.
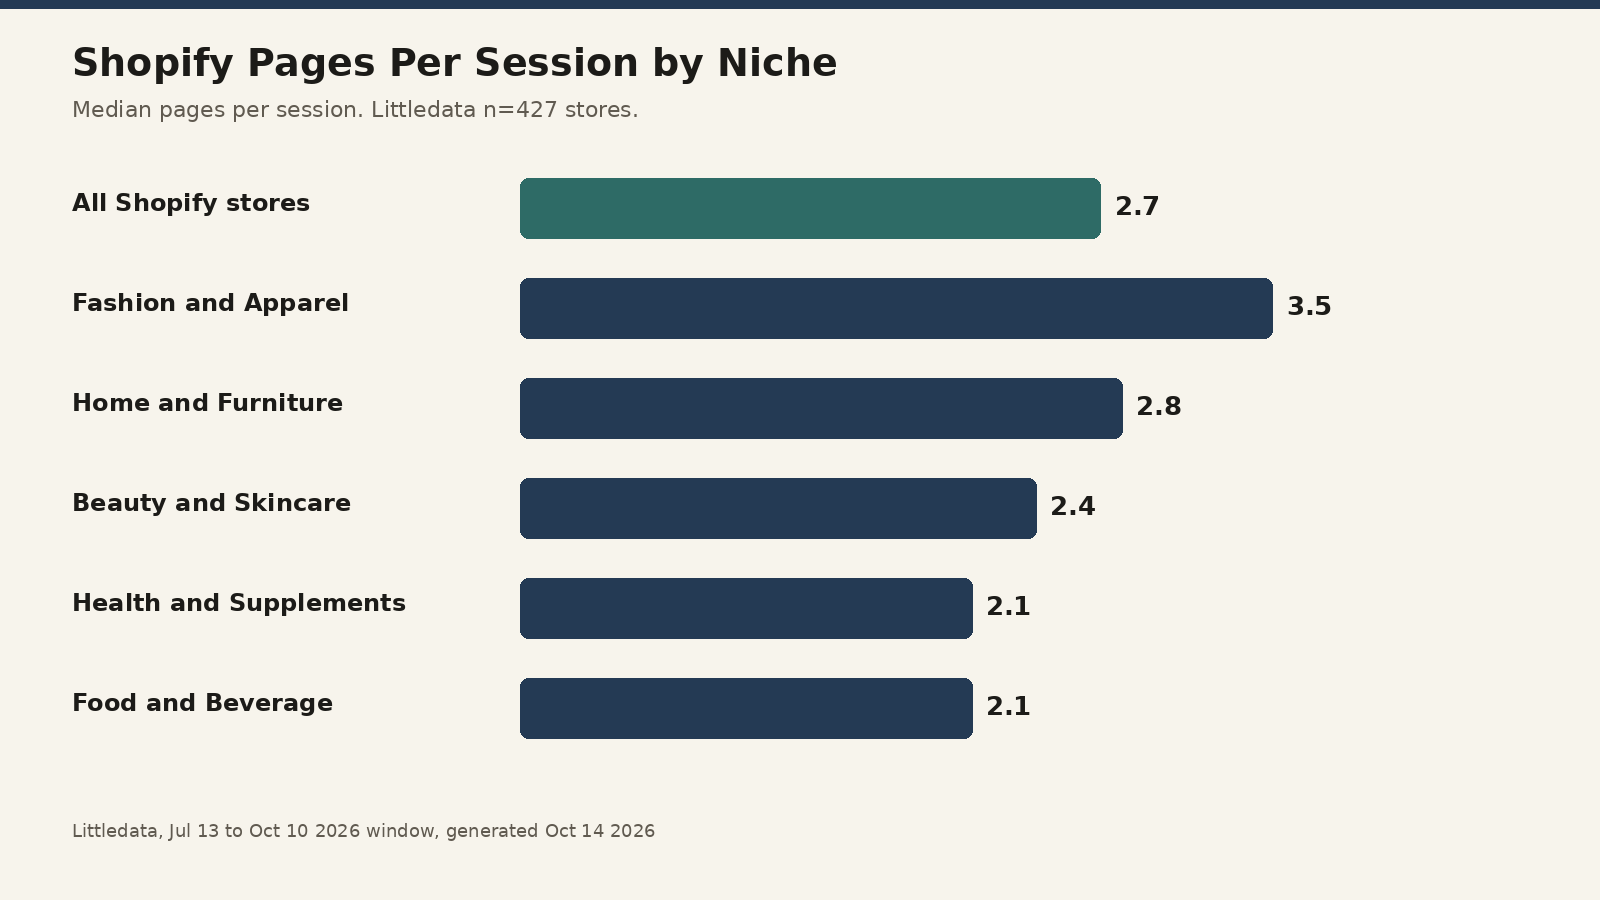
Source: Littledata, 2026. https://www.littledata.io/benchmarks/pages-per-session
ConversionBench publishes Contentsquare DXB 2024 ecommerce (D2C retail) pages per session at p25 1.8, p50 2.8, p75 4.5, and notes the cut reflects browse-category to PDP behavior (ConversionBench). Contentsquare’s own free press pages emphasize relative moves more than that absolute p50, so keep the citation chain honest: Contentsquare DXB 2024 via ConversionBench for the percentile table.
| Band | Contentsquare ecommerce D2C (DXB 2024) | Littledata Shopify (2026) |
|---|---|---|
| Lower | p25 1.8 | Bottom 20% under 1.7 |
| Center | p50 2.8 | Median 2.7 |
| Upper | p75 4.5 | Top 20% at/above 4.1 |
Source: ConversionBench citing Contentsquare DXB 2024; Littledata Shopify n=427. https://conversionbench.com/benchmark/pages-per-session/ecommerce · https://www.littledata.io/benchmarks/pages-per-session
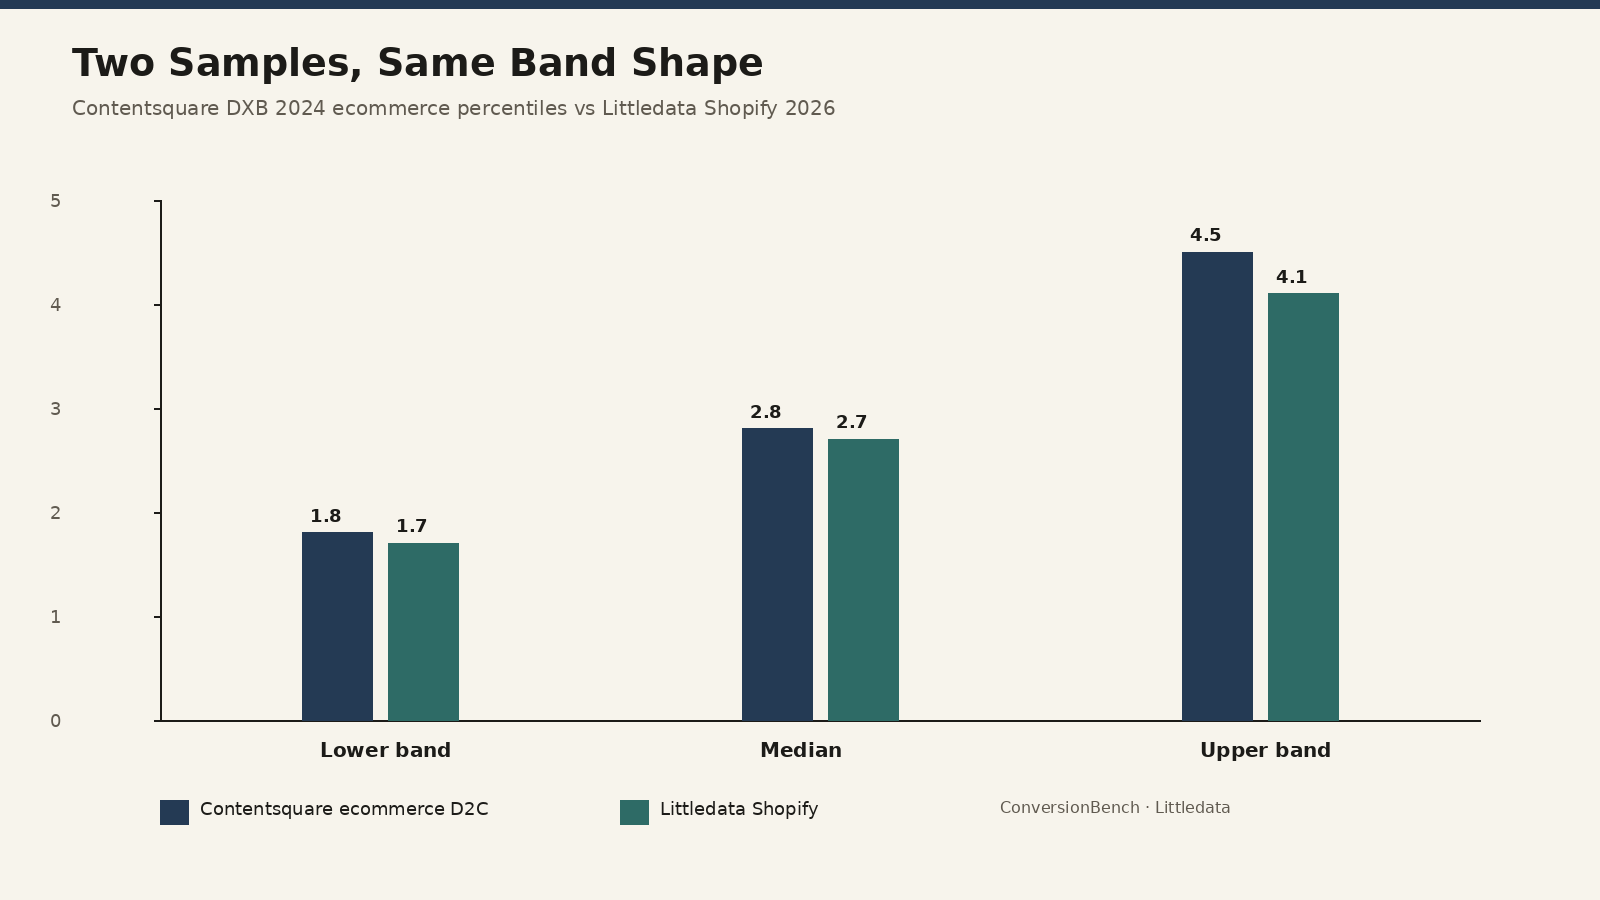
Source: ConversionBench (Contentsquare DXB 2024) and Littledata (2026). https://conversionbench.com/benchmark/pages-per-session/ecommerce · https://www.littledata.io/benchmarks/pages-per-session
Two different samples still rhyme. Center mass sits near 2.7-2.8. Upper bands start around 4. Treat that as a browse envelope for catalog sites, not a law for every URL type. When your store sits under the lower band after you fix SPA events, the first question is discovery, not “add more pages.” When your store sits in the upper band with weak conversion, the first question is intent quality, not “force fewer pages.” Depth without a job is noise.
Contentsquare’s 2024 Retail Digital Experience Benchmark covers more than 25 billion sessions and 130 billion page views across 1,673 websites (Contentsquare). In that retail cut, mobile already carries most of the traffic while sessions get shorter and shallower. Desktop conversions run 77% higher than mobile. If your pages-per-visit chart ignores device, you will “fix” a desktop problem that is mostly a mobile path problem. Keep that next to the mobile vs desktop conversion rate gap.
The broader Contentsquare DXB materials also report session depth down about 1.4% year over year and a typical desktop session about 1.5 pages deeper than mobile (Contentsquare DXB explorer). Directional only. Do not invent a universal absolute from the trend line.
SPA instrumentation is a separate failure mode. If your storefront is React or Next and route changes never fire as page_view, GA4 will under-count depth while the shopper still browsed (ConversionBench). Fix the meter before you rewrite the merchandising.
Pull pages per session for the last 90 days so the window matches Littledata’s store ranking habit. Split by device before you panic. If desktop sits near your niche median and mobile sits in the bottom band, the sprint is mobile path work, not a catalog rewrite. If both sit under 1.7 on a Shopify catalog that should browse, check discovery: collection merchandising, search, and related products. If both sit above 4 and conversion is flat, you may be measuring curiosity without purchase intent. Pair the depth chart with product page conversion rate benchmarks and checkout conversion rate benchmarks before you celebrate a long click path.
Creator and affiliate storefronts inherit the same trap when the sell surface is a thin link stack. A creator storefront that sends shoppers straight to one offer can post a low pages-per-visit number and still win on revenue. Judge the job, not the vanity depth.
| Job | What a “good” pages per visit looks like | What to optimize instead of raw depth |
|---|---|---|
| Content / FAQ that answers one question | Can be near 1.0-1.5 and still win | Time on page, scroll, next-step CTR |
| Shopify product browse | Near niche median (about 2.1-3.5 in Littledata) | Add-to-cart, PDP CVR, return rate |
| Deep comparison shopping | Upper band (4+) can be healthy | Assisted conversion, not endless clicking |
| Mobile micro-visit | Expect fewer pages than desktop | Friction, load, thumb path |
| SPA storefront | Trust the event map before the number | Virtual page_view coverage |
Q: What is a good pages per visit benchmark for ecommerce? A: In Littledata’s 427 Shopify stores, the median is 2.7 and the top 20% start at 4.1. ConversionBench’s Contentsquare DXB 2024 ecommerce cut puts p50 at 2.8 and p75 at 4.5. Match your niche before you chase the top band.
Q: Is pages per session the same as pages per visit? A: In practice yes. Both divide page views by sessions or visits. Confirm your analytics tool’s session definition, especially the 24-hour and engagement rules in GA4, before you compare to a published sample.
Q: Why is my blog’s pages per visit so low? A: A one-page answer can be success. Content and media sites often sit lower than ecommerce browse paths. Judge the job. If the searcher got the answer and converted or subscribed, a low page count is not a bug.
Q: Do mobile sessions always show fewer pages? A: Contentsquare’s 2024 retail cut reports mobile shoppers spend 60% less time and view fewer pages than desktop, with desktop conversions 77% higher. Expect a device split. Fix mobile friction before you force more page hops.
Q: Can SPAs under-report pages per visit? A: Yes. If route changes never register as page_view events, session depth looks artificially low. ConversionBench flags that SPA trap on the Contentsquare DXB ecommerce note. Audit instrumentation before you rewrite the catalog.
A pages per visit benchmark is a job ladder, not a universal target. Shopify medians sit near 2.7, Contentsquare ecommerce p50 near 2.8, fashion runs hotter, and mobile runs shallower. Put the number next to conversion and device, not next to ego.
When the catalog is ready for creators to sell with you, list it on feat..
SaaS PPC landing conversion rates: Unbounce SaaS 3.8%, WordStream Business Services 5.14%, First Page Sage PPC 0.7%; meters differ.
PowerReviews 2022 sites show a 3.8% served-UGC lift and 108.6% when shoppers interact. Reliance Ladder. Not a store forecast.
Forced ranking of HubSpot, OptinMonster, Sumo, and Poptin for exit-intent popups by job seat and plan gates, not invented conversion rates.