SaaS PPC Landing Page Conversion Rates (2026)
SaaS PPC landing conversion rates: Unbounce SaaS 3.8%, WordStream Business Services 5.14%, First Page Sage PPC 0.7%; meters differ.
Conversion rate by marketplace only works when formulas match. Shopify median 1.4%, Etsy 1-5% expect, Amazon USP is units÷sessions.

TL;DR: Conversion rate by marketplace is only useful when you match the formula, the traffic intent, and the trust stack. Shopify’s public median is 1.4% of sessions (n=426, mid-2026). Etsy tells sellers to expect about 1-5%. Amazon’s unit session percentage counts units ÷ sessions, not orders. Do not average those into one fake number.
Someone drops a slide: “Amazon converts at 12%. Our Shopify store is at 2%. Fix the theme.” That slide usually mixes three different meters, three buyer mindsets, and one bruised ego.
Conversion rate by marketplace is the question multichannel sellers actually ask. The honest answer is a ladder, not a league table. Pair this spoke with Shopify conversion rate benchmarks for the owned-store percentile ladder, and with affiliate marketing conversion rate benchmarks by niche when the “marketplace” is a network of clicks, not a retail PDP.
Conversion rate by marketplace is a comparison of how often shopping sessions (or visits) become purchases on each selling surface, using that surface’s own conversion formula.
On an owned Shopify store, the usual meter is orders divided by sessions. On Etsy, Shop Stats define conversion rate as the percentage of visits that resulted in an order (Etsy Help). On Amazon, the headline conversion metric in Business Reports is unit session percentage: units ordered divided by sessions (Seller Central). Those are related ideas with different numerators.
If you paste Amazon USP next to Shopify session CVR and call it “marketplace performance,” you are not analyzing. You are cosplaying a dashboard.
Wrong cross-marketplace CVR math burns budget. Teams kill a DTC channel that is profitable per order because it “converts worse” than a marketplace listing that starts further down the funnel.
| Surface | Formula | Public anchor on this page | Fair comparison set |
|---|---|---|---|
| Shopify own store | Orders ÷ sessions | Median 1.4%; top 20% 2.7%; top 10% 3.5% (Littledata n=426, Jul-Oct 2026) | Other Shopify stores, same traffic mix |
| Etsy shop | Orders ÷ visits | Expect about 1-5% (Etsy Handbook, 2019 internal analysis) | Other Etsy shops in similar price/category |
| Amazon detail page | Units ÷ sessions (unit session %) | Formula from Business Reports definitions; no public all-category average here | Your ASINs vs category peers over time |
| Affiliate network listing | Sales ÷ clicks (network CVR) | Vertical ladders on niche spoke | Same network, same vertical |
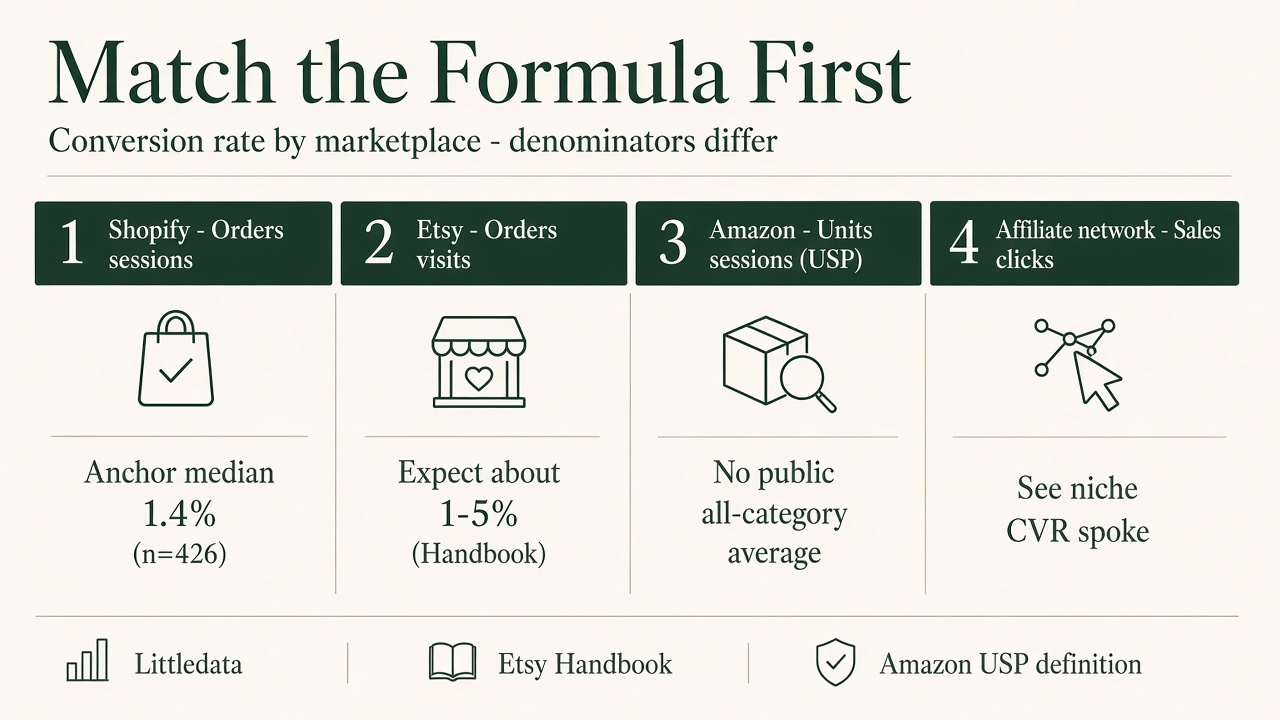
Source: Littledata Oct 2026 Shopify panel; Etsy Seller Handbook 1-5% expect band; Amazon Seller Central unit session percentage definition; affiliate verticals via AvidAffiliate/Skimlinks on the niche spoke. https://www.littledata.io/ecommerce-conversion-rate · https://www.etsy.com/seller-handbook/article/624088232713
Conversion rate by marketplace works when you climb the Marketplace Denominator Ladder: lock the formula, name the intent, name the trust stack, then compare only inside one surface. Skip a rung and the chart becomes fiction.
Write the equation before you open a benchmark tab.
If one channel counts units and another counts orders, stop. Convert both to the same numerator or abandon the comparison.
Marketplace search is often mid-to-late funnel. The shopper typed a product class or brand into Amazon or Etsy. Your Shopify store also receives branded search, email, and returning buyers, but the blended sitewide rate includes blog SEO, cold paid social, and accidental mobile landings. Segment DTC by channel before you call the store “broken” against a marketplace ASIN.
Amazon and Etsy shoppers reuse saved payment methods and marketplace return norms. A first-visit brand site asks for more belief per click. That is economics, not a theme failure. Improve PDP proof, shipping clarity, and checkout, but do not use Amazon USP as the pass/fail line for DTC.
On Shopify, Littledata’s October 2026 ladder is the cleanest public owned-store scorecard on this page:
| Tier (Littledata Shopify, n=426) | Conversion rate |
|---|---|
| Bottom 20% | 0.5% |
| Median | 1.4% |
| Top 20% | 2.7% |
| Top 10% | 3.5% |
Industry medians inside the same panel stretch from Beauty & Skincare 2.8% to Home & Furniture 0.9%, with Fashion 1.3%, Food & Beverage 2.3%, and Health & Supplements 2.5% (Littledata). For deeper Shopify device and panel contrast, use Shopify conversion rate benchmarks.
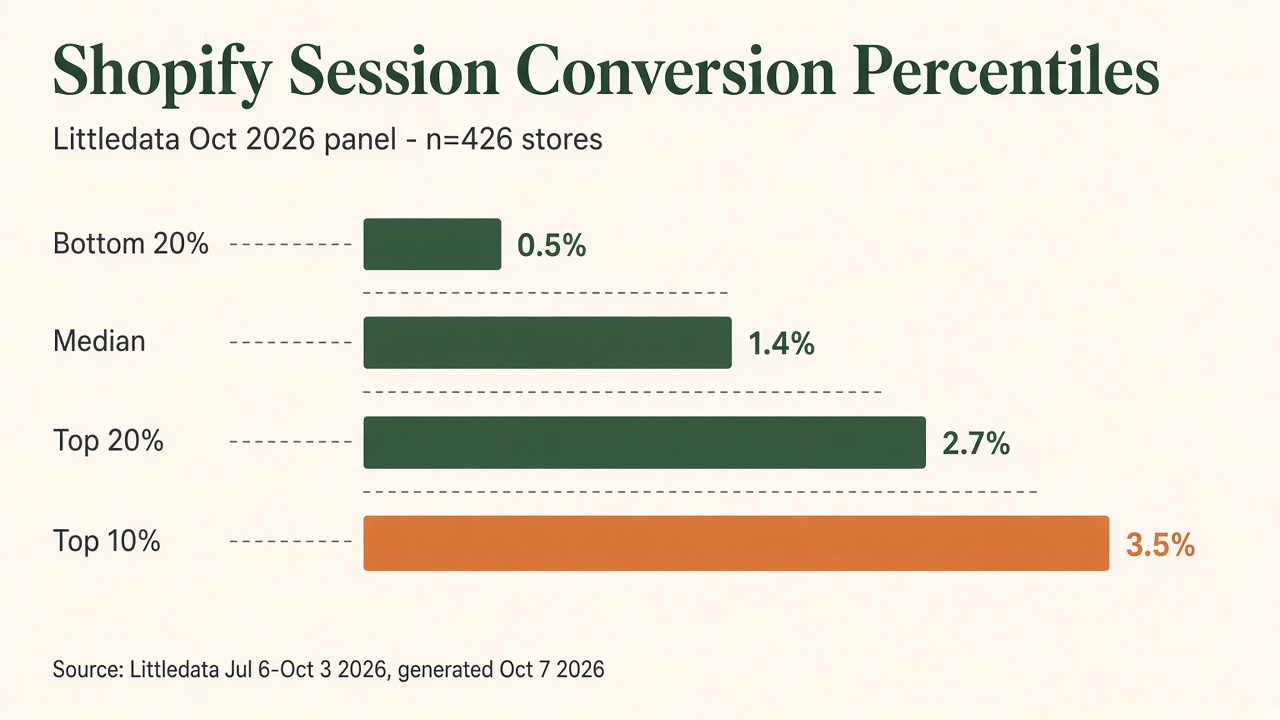
Source: Littledata, Average Ecommerce and Shopify Conversion Rate, figures generated Oct 7, 2026 for Jul 6-Oct 3, 2026 (n=426). https://www.littledata.io/ecommerce-conversion-rate
On Etsy, treat 1-5% as an expect band from the Handbook’s 2019 internal analysis, not a live 2026 census (Etsy Handbook). Compare your shop to its own trailing 30/90 days and to similar price points.
On Amazon, track USP and Buy Box by ASIN over time. Do not paste a blog’s “average Amazon conversion rate” into a board deck unless the post names sample, category, and window. This page marks a platform-wide Amazon average as no public dataset.
When channels disagree, put contribution margin and contribution per session next to CVR. A 1.8% Shopify rate on high-margin owned checkout can beat a higher marketplace USP after fees, ads, and returns. Co-branded creator storefronts on feat. are another surface: judge them with the same honesty about formula and traffic quality, not with an Amazon USP slogan.
A practical weekly scorecard for multichannel teams:
If the board still wants one chart, chart profit per unit by channel. Leave CVR on separate small multiples so nobody “averages” Amazon into Shopify. That habit alone prevents most false CRO emergencies.
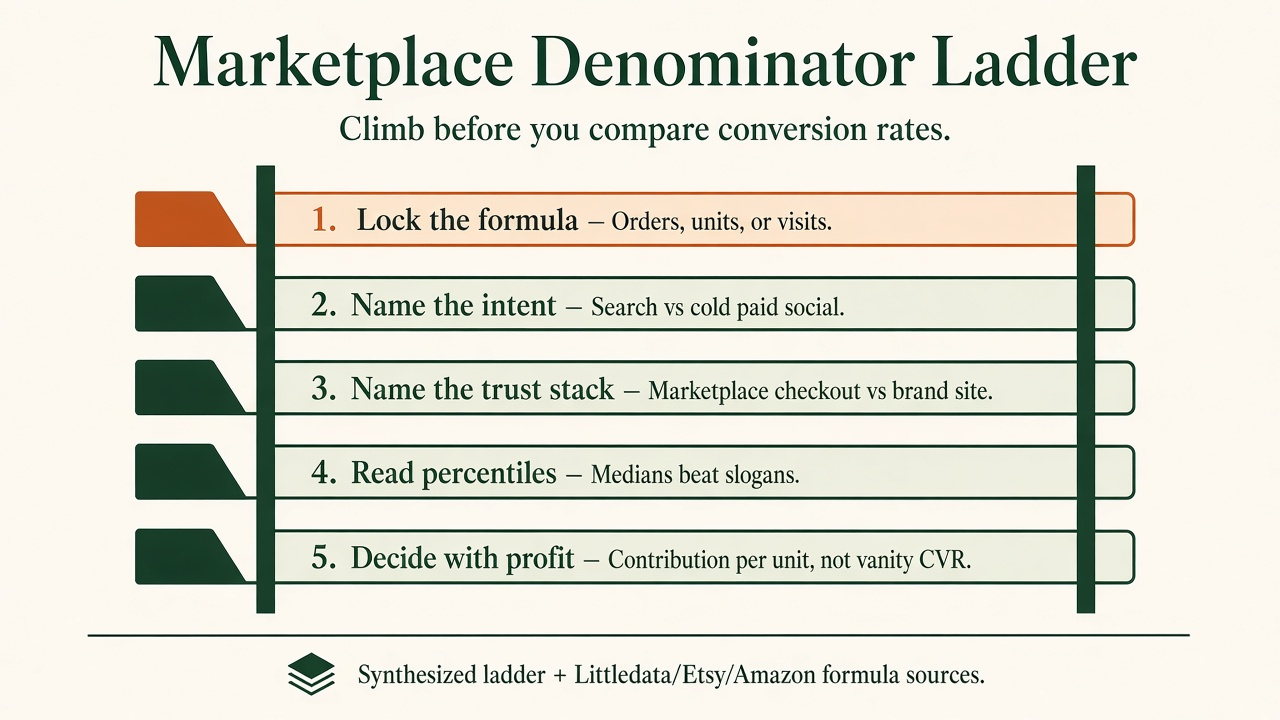
Source: Ladder synthesized for this article; numeric anchors from Littledata Oct 2026 and Etsy Handbook; Amazon USP formula from Seller Central Business Reports definitions. https://www.littledata.io/ecommerce-conversion-rate
Q: What is conversion rate by marketplace?
A: It is a comparison of purchase conversion across selling surfaces such as Amazon, Shopify, and Etsy. It is only valid when each rate uses that surface’s formula and a comparable traffic mix.
Q: Why is Amazon conversion rate higher than Shopify?
A: Often because the meters differ (units ÷ sessions vs orders ÷ sessions) and because marketplace search traffic is higher intent with borrowed checkout trust. Without matched formulas and segments, the gap is not a theme score.
Q: What is a good Etsy conversion rate?
A: Etsy’s Seller Handbook says sellers should generally expect about 1-5%, based on internal 2019 analysis, and stresses category and price variation (Etsy Handbook). Use your own trailing periods as the primary benchmark.
Q: What is Amazon unit session percentage?
A: Unit session percentage is units purchased divided by sessions for the selected period, expressed as a percentage, per Amazon Business Reports definitions (Seller Central). It is not identical to an orders-based conversion rate.
Q: Is there one official conversion rate by marketplace table?
A: No. There is no public dataset that standardizes Amazon, Shopify, and Etsy into one comparable census with identical events. Use surface-specific anchors (Littledata for Shopify, Handbook bands for Etsy, USP trends for Amazon) and profit for cross-channel decisions.
Conversion rate by marketplace is a discipline problem before it is a CRO problem. Match the denominator, admit the intent gap, and keep Amazon USP out of your Shopify KPI. Shopify’s public median sits at 1.4% of sessions. Etsy still points sellers at roughly 1-5%. Amazon counts units per session. Build channel strategy on those truths, not on a blended myth.
If you distribute through co-branded creator storefronts instead of only marketplace listings, start at feat..
SaaS PPC landing conversion rates: Unbounce SaaS 3.8%, WordStream Business Services 5.14%, First Page Sage PPC 0.7%; meters differ.
PowerReviews 2022 sites show a 3.8% served-UGC lift and 108.6% when shoppers interact. Reliance Ladder. Not a store forecast.
Pages per visit benchmark: Littledata Shopify median 2.7, fashion 3.5, Contentsquare ecommerce p50 2.8. Match the job. Refuse one universal good.