SaaS PPC Landing Page Conversion Rates (2026)
SaaS PPC landing conversion rates: Unbounce SaaS 3.8%, WordStream Business Services 5.14%, First Page Sage PPC 0.7%; meters differ.
Product image conversion rate impact: Baymard 56% first action, 25% fail zoom, 40% fail mobile gestures, 76% lack thumbnails. Use the Image Proof Ladder.

TL;DR: Product image conversion rate impact is an Image Proof Ladder, not a “more photos” slogan. Baymard finds 56% of shoppers inspect images first on the PDP. 25% of sites fail resolution or zoom, 40% fail mobile pinch or tap zoom, 52% fail landscape scale, and 76% of mobile sites skip thumbnails. Finish the proof job before you shoot another hero crop.
Merchants Google product image conversion rate impact and get one lazy answer: add more photos. That advice skips the meter. Shoppers already treat the gallery as the first proof surface. When zoom, thumbnails, and scale fail, traffic never reaches your offer copy.
Product image conversion rate impact matters when you decide whether the leak is creative taste or a published gallery failure. This page sits next to product page conversion rate benchmarks, product reviews conversion rate impact, size guide conversion rate impact, and cart abandonment rate reasons and fixes.
Product image conversion rate impact is the measured change in purchase likelihood or conversion when shoppers can finish visual proof on the product page (clarity, angles, zoom, scale, and social proof photos) compared with a gallery that blocks that proof.
It is not “pretty lifestyle shots.” Baymard separates image jobs into types such as scale, compatibility, textural detail, and UGC-style proof (Baymard). A second packshot of the same angle does not climb that ladder. A zoomable detail shot can.
It is also not the full PDP grade. Product page conversion rate benchmarks already own Baymard’s decent/good versus mediocre UX scores and session ATC meters. This page owns the gallery as its own conversion lever: the Image Proof Ladder from hero clarity through UGC proof.
Broken galleries burn paid traffic before price and shipping ever get a fair hearing. The first click is usually on the photos.
Score the gallery with five labeled rungs. Quote Baymard failure rates as leak meters, not as invented lift percentages. Climb the Image Proof Ladder before you book another studio day for duplicate angles.
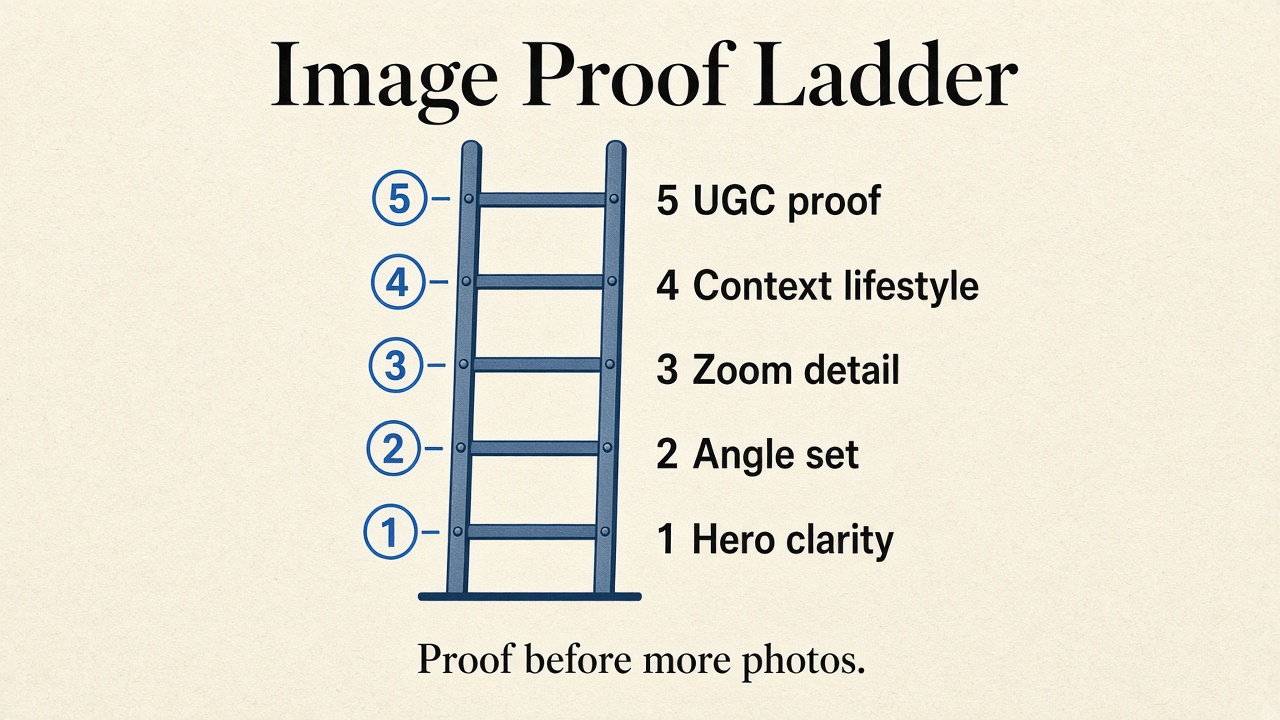
Source: feat. editorial Image Proof Ladder synthesis of Baymard product-image UX research, 2026. https://baymard.com/research-articles/ux-product-image-categories
Baymard’s landscape article states that 56% of users’ first action on a product page is to inspect the images (Baymard). That single meter should reorder your CRO backlog. Copy A/B tests that ignore gallery latency, crop, and zoom are optimizing the second conversation.
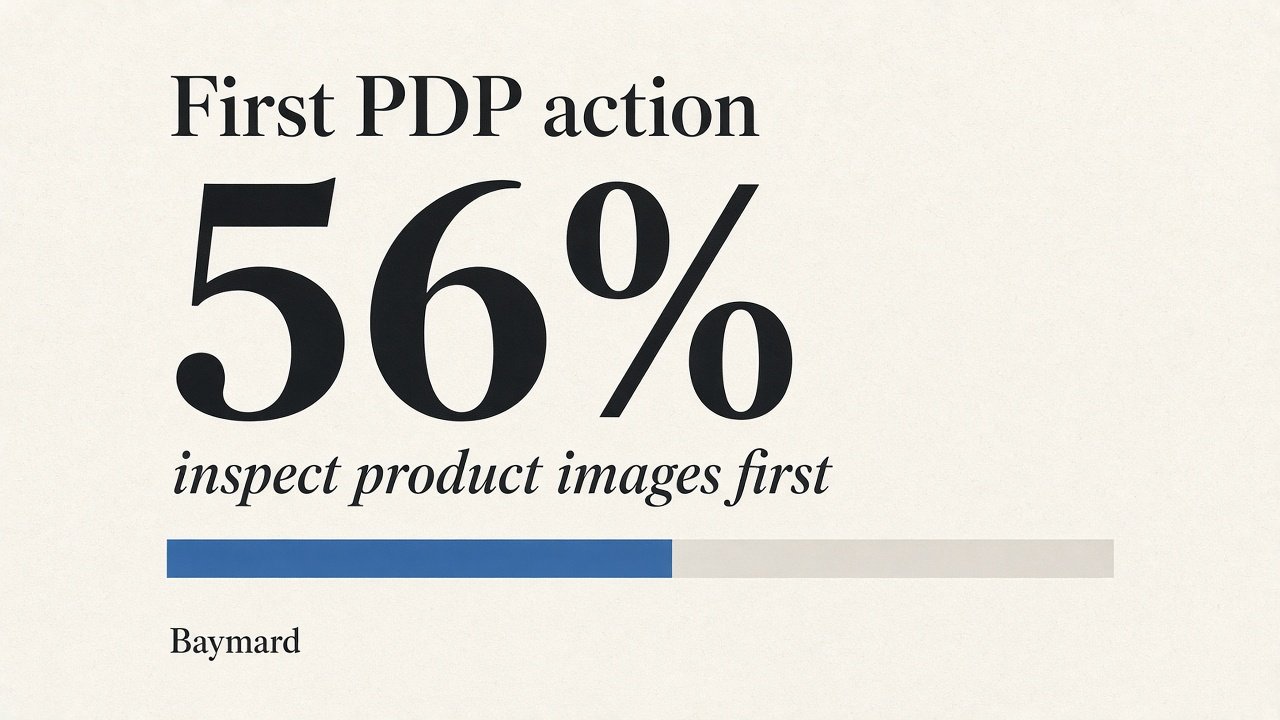
Source: Baymard Institute, Scale Mobile Product Images in Landscape. https://baymard.com/blog/scale-mobile-product-images-in-landscape
Baymard publishes site-failure rates for the jobs shoppers already try. Use them as an audit checklist, not as a promise that fixing one row adds a magic CVR point.
| Gallery failure | Published share | What shoppers lose | Source |
|---|---|---|---|
| Insufficient resolution or zoom (popular categories) | 25% of sites | Texture, stitch, finish detail | Baymard |
| Low-resolution imagery | 14% of sites | Clarity at native size | Same |
| Inadequate zoom implementation | 11% of sites | Controllable close-up | Same |
| Insufficient zoom level | 5% of sites | Detail even when zoom opens | Same |
| Desktop zoom present | 93% of sites | Presence is not quality | Same |
| Mobile pinch or tap zoom fails | 40% of sites (n=50 top-grossing US mobile) | Expected phone gestures | Baymard |
| Landscape does not scale proportionally | 52% of sites | Usable rotated view | Baymard |
| No thumbnails for additional images (mobile) | 76% of mobile sites | Discoverable second+ photos | Baymard |
| Truncated thumbnail strip | 30% get it wrong; 50-80% of users may overlook extras | Hidden inventory of proof | Same |
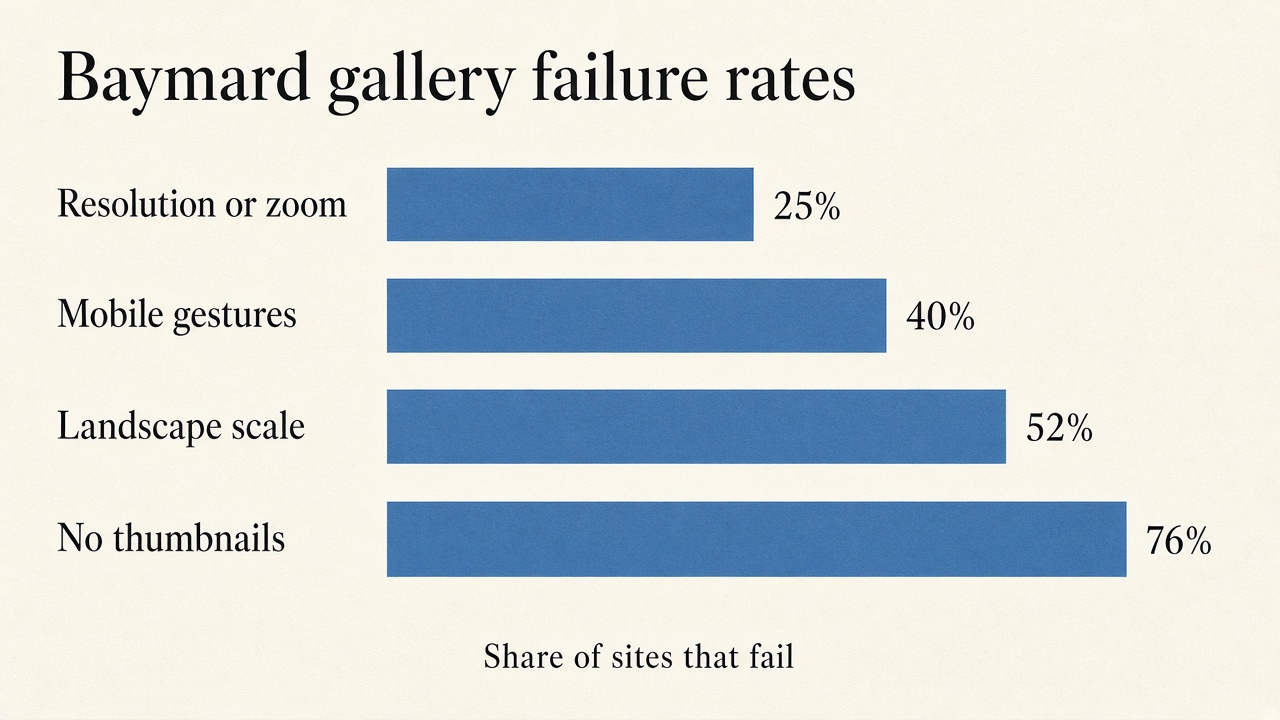
Source: Baymard Institute product-image UX articles (resolution/zoom, mobile gestures, landscape scale, thumbnails), accessed 2026. https://baymard.com/research-articles/ensure-sufficient-image-resolution-and-zoom
| Ladder rung | Proof job | Common fail mode | Baymard-linked signal |
|---|---|---|---|
| 1. Hero clarity | Identify the product in one glance | Soft crop, busy props, tiny subject | First action concentrates on images (56%) |
| 2. Angle set | Rotate understanding of form | Five near-identical packshots | Image-type coverage, not photo count (Baymard) |
| 3. Zoom / detail | Inspect texture and construction | 25% resolution/zoom fail; 40% mobile gesture fail | Resolution and gesture articles |
| 4. Context / lifestyle | Judge scale and use | 37% lack in-scale; 23% lack human model; 42% try to judge size from images | PDP UX state |
| 5. UGC proof | See the product in someone else’s hands | Gallery never surfaces customer photos; reviews stay text-only | Pair with product reviews conversion rate impact |
Source: feat. Image Proof Ladder; Baymard figures cited in the rows above.
Operators on forums still ask for a single lift percentage from “adding lifestyle shots.” There is no public dataset that averages that lift across niches. Baymard’s published grammar is failure and task coverage, not a universal photo-count elasticity. A merchant who adds three more white-background frontals while mobile still lacks thumbnails has not climbed rung three or five. They have padded the media library.
Affiliate and creator traffic makes the same mistake look worse. A co-branded storefront on feat. can present your offer cleanly, but if the underlying gallery cannot zoom or show scale, the seller inherits your proof debt. Treat image QA as part of distribution readiness, not as a brand mood board.
Improve product image conversion rate impact by auditing Baymard failure modes on your top SKUs, then climbing one Image Proof Ladder rung at a time. Measure with product-view-to-add and product-view-to-order, not with photo-count vanity. Each step is at most two sentences.
Q: Do product images increase conversion rate? A: They can, when they finish the proof jobs shoppers already attempt. Baymard finds 56% of users inspect images first, while large shares of sites still fail zoom, gestures, landscape scale, or thumbnails. That is a leak map, not a promise that any new photo lifts CVR by a fixed percent.
Q: What is a good product image gallery for ecommerce? A: A gallery that climbs the Image Proof Ladder: clear hero, distinct angles, real zoom on desktop and mobile, scale or lifestyle context, and UGC proof when available. Baymard’s image-type research is the coverage checklist; photo count alone is not.
Q: How many product images do I need to convert? A: Enough distinct proof jobs, not a magic integer. Eight near-identical packshots can still lose to four photos that cover clarity, angle, detail zoom, and scale. There is no public dataset for an optimal photo count by niche.
Q: Why do mobile product images convert worse than desktop? A: Often because the mobile gallery fails gestures and discovery. Baymard finds 40% of top-grossing US mobile sites fail pinch or tap zoom, 52% fail proportional landscape scaling, and 76% skip thumbnails. Desktop zoom presence (93%) can hide that mobile debt.
Q: Can I quote a universal conversion lift from adding more product photos? A: No. There is no public dataset that averages photo-count elasticity across all verticals, and no public dataset for feat. storefront image lift. Quote Baymard’s published failure rates, a labeled A/B on your catalog, or leave the cell blank.
Product image conversion rate impact is proof completion, not studio volume. Shoppers start on the gallery (56%). Large minorities of sites still fail the zoom, gesture, landscape, and thumbnail jobs those shoppers try. Climb the Image Proof Ladder rung by rung, and refuse invented universal lift percentages when the public research gives you failure rates instead.
If you built something people can sell for you, list it on feat. so affiliates get a storefront that can show the product clearly before the click dies.
SaaS PPC landing conversion rates: Unbounce SaaS 3.8%, WordStream Business Services 5.14%, First Page Sage PPC 0.7%; meters differ.
PowerReviews 2022 sites show a 3.8% served-UGC lift and 108.6% when shoppers interact. Reliance Ladder. Not a store forecast.
Pages per visit benchmark: Littledata Shopify median 2.7, fashion 3.5, Contentsquare ecommerce p50 2.8. Match the job. Refuse one universal good.