AddShoppers vs Omnisend (Cart Email Seat)
AddShoppers vs Omnisend for cart emails: AddShoppers redirects to Minty. Buy Omnisend's live cart automation with published Free/$16/$59 seats.
Klaviyo industry benchmarks: campaign vs flow first (31%/32.2% opens, 1.69%/5.58% clicks), then industry placed-order bands from one labeled table.

TL;DR: Klaviyo industry benchmarks are a labeled campaign-versus-flow scorecard before any vertical envy. Klaviyo’s 2026 floors put campaign opens near 31% and flow opens near 32.2%, clicks at 1.69% versus 5.58%, and UK-blog placed-order averages at 0.16% versus 2.11%. Flows still generate nearly 41% of email revenue from 5.3% of sends. Read one Klaviyo table; do not mash MailerLite into it.
Founders Google klaviyo industry benchmarks when finance asks why fashion opens look “low.” The trap is comparing a welcome flow to a competitor’s blast, or pasting a MailerLite industry cell into a Klaviyo QBR.
The cross-ESP industry page lives at email marketing benchmarks by industry. Flow hygiene lives in sunset email flow explained. Browse ops live in browse abandonment best practices. This page owns the Klaviyo-named scorecard.
Klaviyo industry benchmarks are labeled average (and sometimes top 10%) open, click, and placed-order rates from Klaviyo’s ecommerce customer sample, split by email campaigns versus automated flows and then by industry vertical.
They are not a universal “good email open rate.” They are not MailerLite’s industry table. They are not a third-party scrape of random Klaviyo accounts sold as “the” 2026 census. Klaviyo’s own products page cites over 183,000 customers; the UK blog cites over 205,000 brands. Treat those as sibling samples, not one reconciled N (Klaviyo; Klaviyo UK).
If you only remember one rule: match the meter (campaign or flow) before you match the industry.
Klaviyo industry benchmarks matter because the wrong peer group produces the wrong fix. You either kill a healthy flow for looking soft next to a blast, or you celebrate a vanity open rate that MPP inflated.
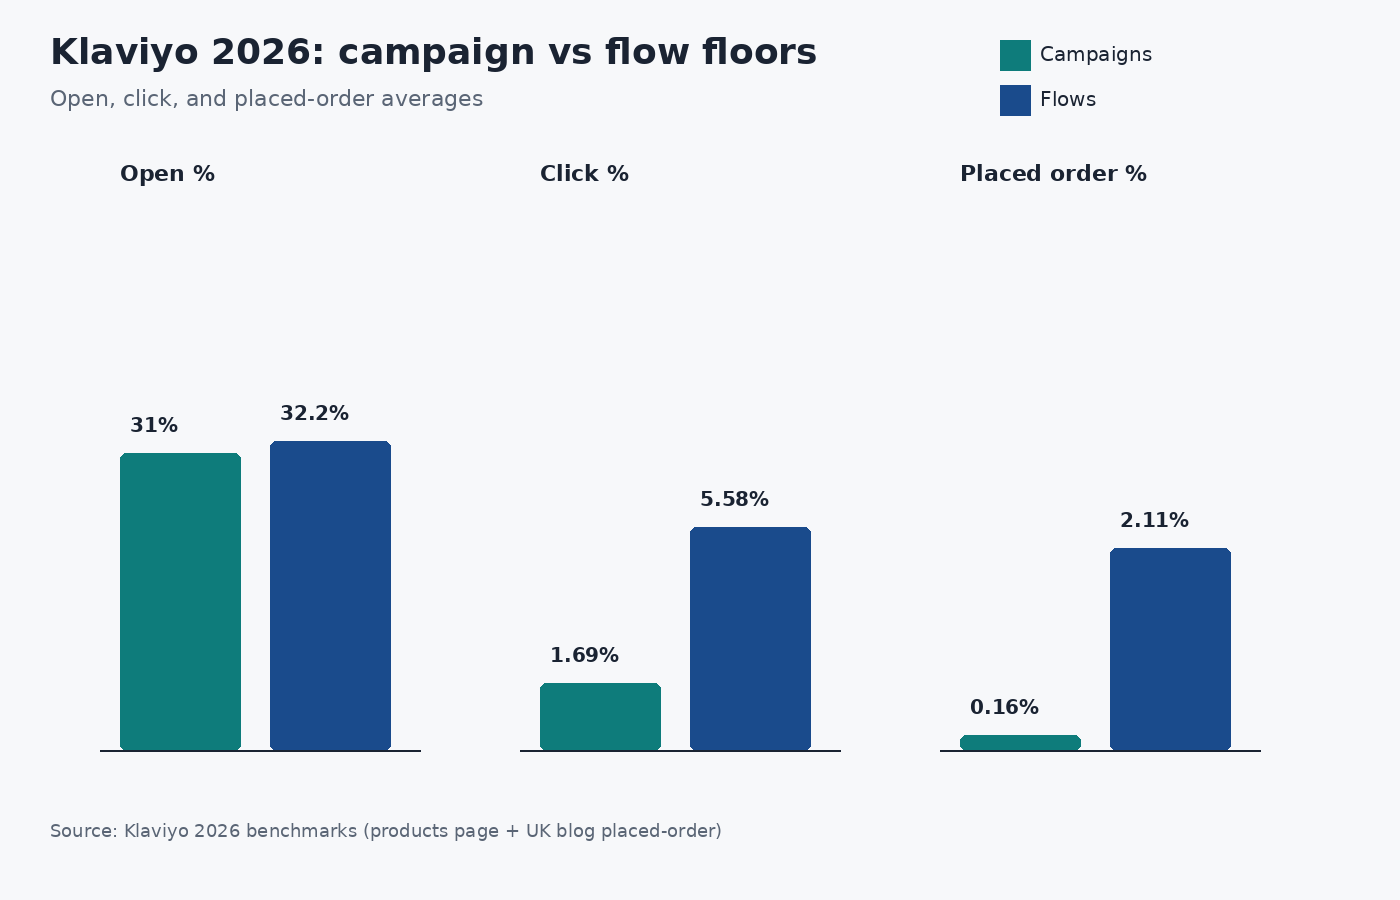
Source: Klaviyo 2026 email marketing benchmarks (products page + UK blog, 24 Feb 2026). https://www.klaviyo.com/products/email-marketing/benchmarks · https://www.klaviyo.com/uk/blog/email-marketing-benchmarks-open-click-and-conversion-rates
Klaviyo industry benchmarks work as a four-rung Klaviyo Industry Scorecard Ladder: campaign versus flow floors, then industry bands from one labeled table, then top-10% ceilings, then revenue-share proof. Skip the first rung and every vertical comparison is noise.
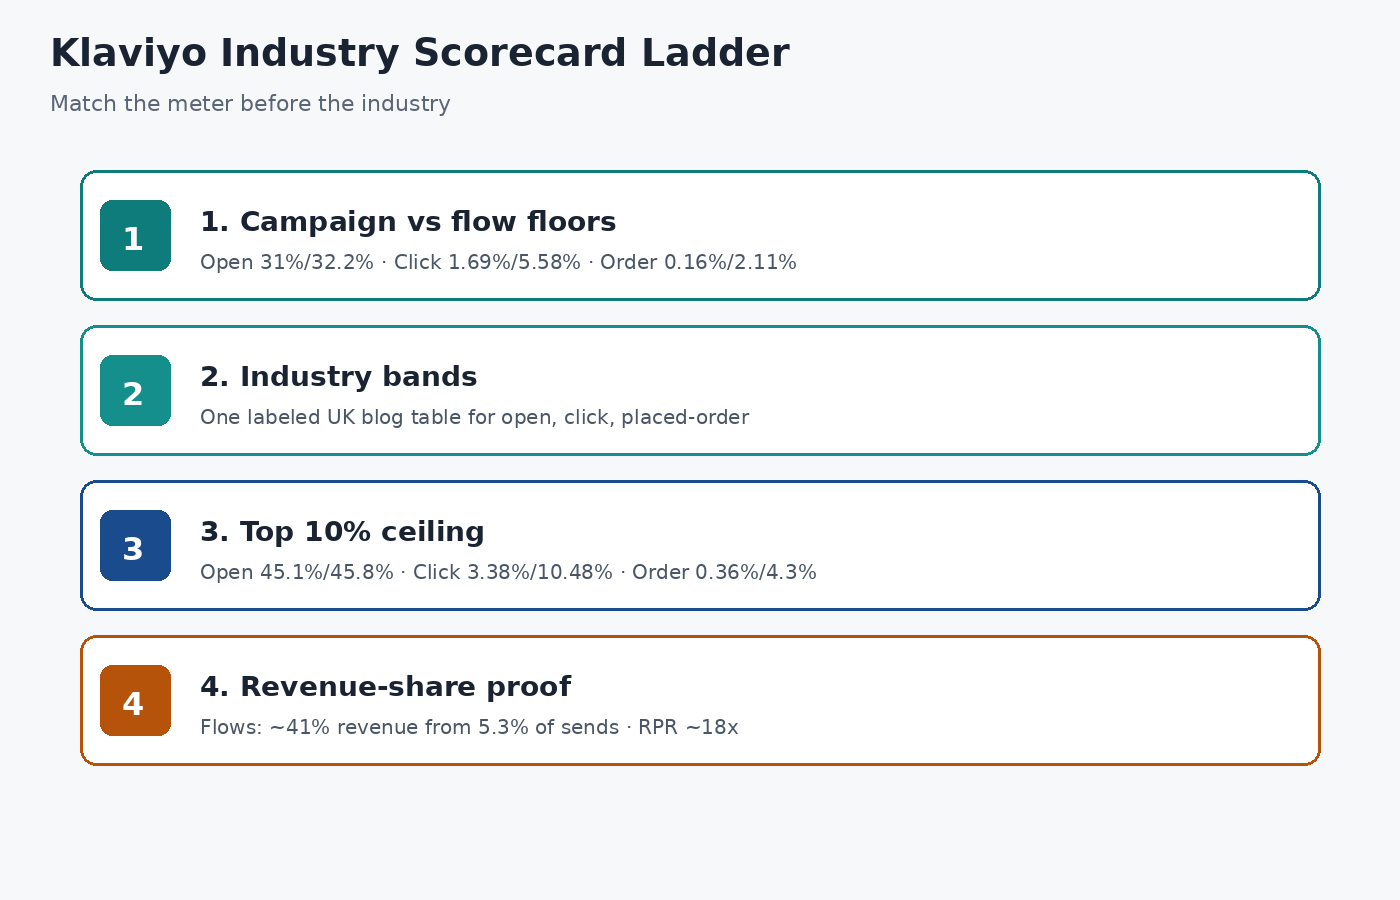
Source: Synthesized from Klaviyo products benchmarks and Klaviyo UK blog (24 Feb 2026). https://www.klaviyo.com/products/email-marketing/benchmarks
| Rung | Decision | 2026 sticker you can defend |
|---|---|---|
| 1. Campaign vs flow floors | Which meter are you reading? | Open 31% / 32.2%; click 1.69% / 5.58%; UK placed-order 0.16% / 2.11% |
| 2. Industry bands | Same meter, your vertical | Use UK blog industry tables for open, click, and placed-order |
| 3. Top 10% ceiling | Ambition, not average | Open 45.1% / 45.8%; click 3.38% / 10.48%; placed-order 0.36% / 4.3% |
| 4. Revenue-share proof | Where to invest hours | Flows: ~41% revenue from 5.3% sends; RPR ~18x campaigns |
| Metric | Campaigns (avg) | Flows (avg) | Top 10% campaigns | Top 10% flows |
|---|---|---|---|---|
| Open rate | 31% | 32.2% | 45.1% | 45.8% |
| Click rate | 1.69% | 5.58% | 3.38% | 10.48% |
| Placed order (UK blog) | 0.16% | 2.11% | 0.36% | 4.3% |
Source: Klaviyo products page (open/click) and Klaviyo UK blog 24 Feb 2026 (placed-order averages and top 10%).
Campaigns are one-off list sends. Flows are behavior-triggered sequences. Mixing them is how a cart flow gets fired for “underperforming opens” next to a promo blast that never had a chance to convert the same way.
Use these as planning peers inside Klaviyo. Do not average them with MailerLite.
Campaign open rate by industry (selected, UK blog)
| Industry | Avg open |
|---|---|
| Clothing & accessories | 33.1% |
| Home & garden | 32.5% |
| Jewellery | 32.5% |
| Specialty | 32% |
| Sporting goods | 31.9% |
| Food & beverage | 31.2% |
| Hardware & home improvement | 30.9% |
| Health & beauty | 30.5% |
| Automotive | 29.4% |
| Electronics | 29.3% |
| Office supplies | 28.9% |
| Mass merchant | 28.7% |
Campaign placed-order rate by industry (selected, UK blog)
| Industry | Avg placed order |
|---|---|
| Food & beverage | 0.26% |
| Health & beauty | 0.19% |
| Toys & hobbies | 0.19% |
| Specialty | 0.18% |
| Mass merchant / Office | 0.14% |
| Home & garden | 0.13% |
| Clothing & accessories | 0.12% |
| Automotive / Hardware / Sporting | 0.11% |
| Electronics | 0.09% |
| Jewellery | 0.08% |
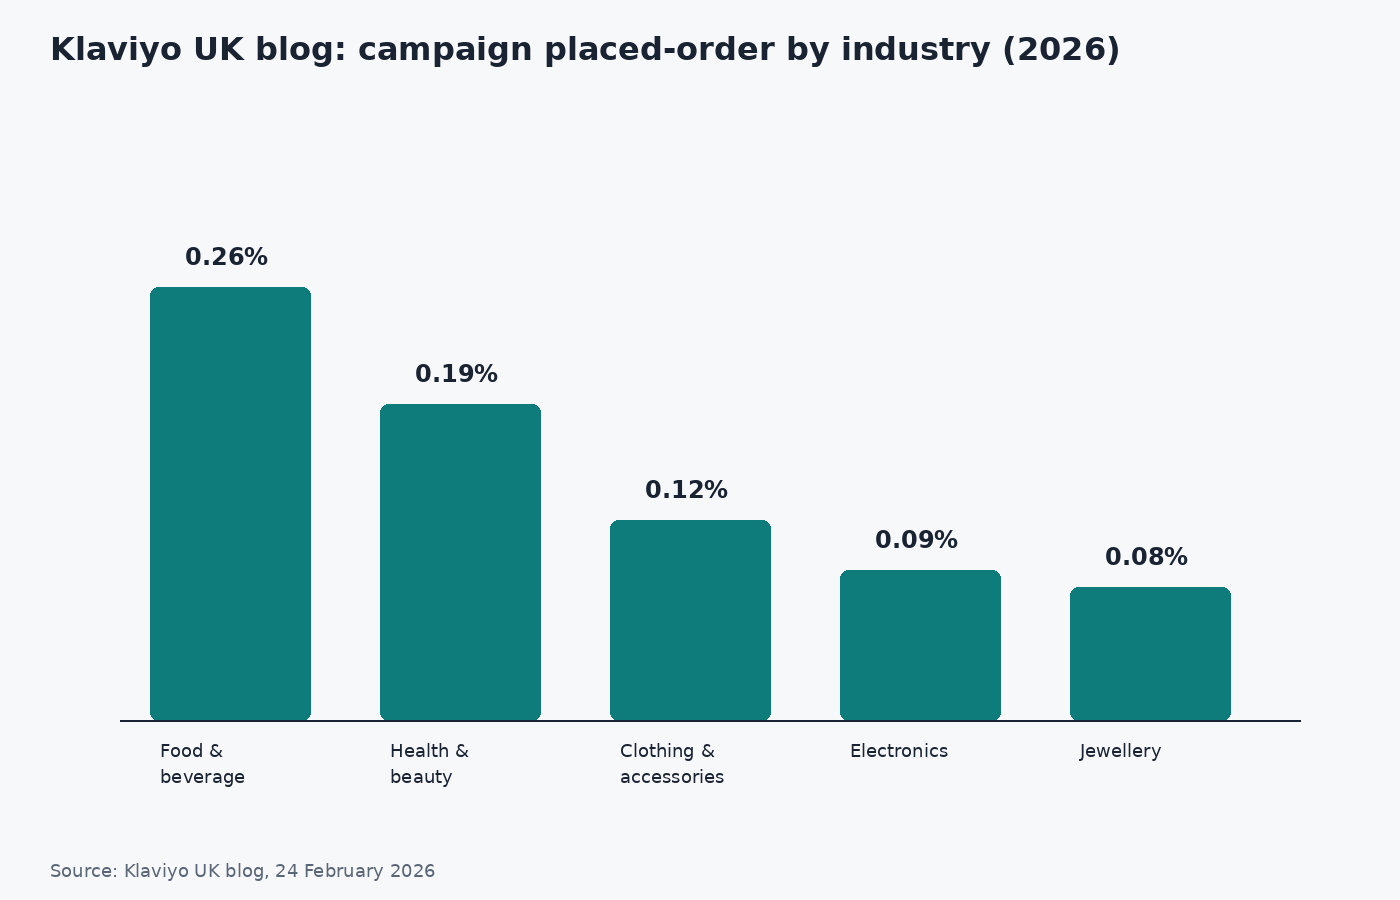
Source: Klaviyo UK blog, 24 February 2026. https://www.klaviyo.com/uk/blog/email-marketing-benchmarks-open-click-and-conversion-rates
Flow placed-order rate by industry (selected, UK blog): food and beverage 2.46%, office supplies 2.18%, clothing 2.15%, home and garden 2.12%, sporting goods 2.13%, jewellery 1.85% (low end of the published set).
Click pattern worth remembering: health and beauty sits soft on campaign click (1.24%) and flow click (4.8%) versus toys campaign click (2.03%) and sporting goods flow click (6.13%) (Klaviyo UK).
Averages are not a finish line. Top 10% campaign clicks at 3.38% and flow clicks at 10.48% show the efficiency gap Klaviyo highlights; top flow RPR is cited as high as $7.79 on the products page (Klaviyo). Use ceilings for roadmap ambition. Use averages for whether you are broken.
If your calendar is 95% campaigns, you are optimizing the volume bucket, not the revenue bucket. Klaviyo’s highlight that flows drive nearly 41% of email revenue from 5.3% of sends is the argument for building welcome, browse, cart, and post-purchase before another blast theme (Klaviyo). Sibling browse dollars and filters live in browse abandonment email benchmarks and browse abandonment best practices.
Klaviyo’s products page also lists “average ecommerce email conversion rates by industry” with campaign figures near 0.97-1.34% and flow figures near 1.62-2.17%. Those cells do not match the UK blog’s campaign placed-order average of 0.16% or its industry placed-order table. Until Klaviyo publishes one reconciled definition, this article charts only the UK blog placed-order tables plus the shared open/click floors. Mixing the two into one “Klaviyo conversion by industry” graphic would be fabrication.
When email recovers soft intent and creators still need a sell surface, co-branded storefront distribution on feat. is the merchant-side complement, not a substitute for flow math.
Q: What are Klaviyo industry benchmarks? A: They are Klaviyo’s labeled averages (and top 10% marks) for open, click, and placed-order performance, split by campaigns versus flows and then by industry. Use one Klaviyo table at a time; do not paste MailerLite industry cells into a Klaviyo review.
Q: What is a good Klaviyo open rate in 2026? A: Klaviyo’s 2026 floors put campaign opens near 31% and flow opens near 32.2%, with top 10% near 45.1% and 45.8%. Treat opens as directional after Apple Mail Privacy Protection and pair them with click and placed-order.
Q: How do Klaviyo campaign benchmarks differ from flow benchmarks? A: Flows beat campaigns on the efficiency meters that matter: about 3x click rate (5.58% vs 1.69%) and about 13x placed-order rate on the UK blog averages (2.11% vs 0.16%), while generating nearly 41% of email revenue from 5.3% of sends.
Q: Which industry has the highest Klaviyo placed-order rate? A: In the UK blog’s 2026 campaign table, food and beverage leads at 0.26% placed-order; jewellery sits at the low end at 0.08%. On flows, food and beverage again leads the published set at 2.46% versus jewellery at 1.85%.
Q: Are Klaviyo industry benchmarks the same as MailerLite industry benchmarks? A: No. Different ESP samples, different industry labels, and different campaign-versus-flow treatment. Our email marketing benchmarks by industry page covers the cross-ESP view; this page stays on Klaviyo-native stickers only.
Klaviyo industry benchmarks reward founders who climb the Scorecard Ladder in order: campaign versus flow, then industry, then top 10%, then revenue share. The public 2026 floors and UK blog industry tables are enough to stop fake envy without inventing a blended conversion graphic from conflicting Klaviyo pages. When the offer needs people selling through co-branded storefronts instead of another blast, list it on feat..
AddShoppers vs Omnisend for cart emails: AddShoppers redirects to Minty. Buy Omnisend's live cart automation with published Free/$16/$59 seats.
GetResponse double opt-in is off by default. Enable the list confirmation toggle, match form surfaces, and remember DOI alone is not GDPR compliance.
Mailing CPM is cost per 1,000 list recipients. Use Carroway size-band medians ($62.50→$7.77) and placement types—not one fake “good CPM.”